wikiHow is a “wiki,” similar to Wikipedia, which means that many of our articles are co-written by multiple authors. To create this article, 11 people, some anonymous, worked to edit and improve it over time.
This article has been viewed 49,603 times.
Learn more...
Bézier curves are used in PhotoShop, animation, auto manufacturing, film special effects, higher math curve analysis and for many other functions. In this article, learn to use Bézier curves and the formulas they're based on to create Excel charts of curves, which are exacting. Bézier curves can also handle rational curves, like circles, with a bit of math tweaking -- but that's reserved for a subsequent article, if sufficient interest is generated. You'll be learning three types of curves in this article: the straight line's interpolation, the quadratic curve and the cubic curve. Bézier curves are not limited to 2 dimensions but can visualize more, many more in fact, which is one reason math pros find them very, very exciting! The math presented here is not terribly difficult and while some derivatives will be shown since Bézier curves are used to calculate the rate at which an object moves along a curve, they will not be much elaborated upon for now.

Preparation
-
1
-
2Open a new Excel workbook and prepare 2 worksheets:
- Either click on the green "X" icon, or double-click on Excel in the Microsoft Office folder in your Applications folder by opening a Finder window, in order to start Excel;
- Using the File menu or the icon, Open a new workbook;
- Save the workbook as "Bezier Curves" into a logical folder, such as "wikiHow Articles" or "MS XL Imagery";
- Create via the + button at the bottom or access the second worksheet tab and double-click edit-name it "Saves" -- this will be used to Paste Values and Charts to which you wish to keep and remember, while still having the top worksheet tab for doing the main work on -- if you were to copy and paste, the formula results would change with varying inputs on the top worksheet from the Defined Named Variables, which are global;
- Double-click on the first leftmost worksheet tab and edit-name it "3 Curves" (w/o quotes).
Advertisement -
3Set the Preferences, under the Excel menu:
- Be mindful that these settings will affect your future XL work;
- General - Set Show this number of recent documents to 15; set Sheets in new workbook to 3; this editor works with Body Font, in a font size of 12; set your preferred file path/ location;
- View - Check Show formula bar by default; check Indicators only, and comments on hover for Comments; show All for objects; Show row and column headings, Show outline symbols, Show zero values, Show horizontal scroll bar, Show vertical scroll bar, Show sheet tabs;
- Edit - Check all; Display 0 number of decimal places; set Interpret as 21st century for two-digit years before 30; Uncheck Automatically convert date system;
- AutoCorrect - Check all
- Chart - In Chart Screen Tips, check Show chart names on hover, and check Show data marker values on hover; leave the rest unchecked;
- Calculation - Automatically checked; Limit iteration to 100 Maximum iterations with a maximum change of 0.0001, unless goal seeking, then .000 000 000 000 01 (w/o spaces); check Save external link values;
- Error checking - Check all and this editor uses dark green or red to flag errors;
- Save - Check all; set to 5 minutes;
- Compatibility - check Check documents for compatibility
- Ribbon - All checked, except Hide group titles is unchecked.


Do Linear Bezier Curve
-
1Fill in the worksheet's Column Headers and Defined Name Variables
- Enter label t into cell A1;
- Enter label Psub0_X into cell B1;
- Enter label Psub0_Y into cell C1;
- Enter label Psub1_X into cell D1;
- Enter label Psub1_Y into cell E1;
- Enter label Psub2_X into cell F1;
- Enter label Psub2_Y into cell G1;
- Enter label Psub3_X into cell H1;
- Enter label Psub3_Y into cell I1;
- Select columns $A:$I and Insert Name Create in Top Row -- those columns are now Defined Name Variables using the various labels for Points 1 to 3 for both X and Y, plus an interpolation point called t;
- Select Row $1 and do Format Alignment Center and Font Bold;
- (the dollar symbol just means that those variable names or formatting will always pertain to that column or row, absolutely);
- Enter label Interpolater: (with colon and a trailing space) to cell K1 and Format Cells Alignment Right -- this is my own method of adjusting the curves inwards and outwards by a basic overall ratio;
- Enter a 1 to cell L1, Format Fill Canary Yellow (for input) and Font Underline;
- Insert Name Define name Interpolater to cell $L$1;
- Select columns $A:$O and Format Cells Number Custom +0.0000;-0.0000;=0.0000
-
2Start filling in the facts and formulas about the Linear Bézier Curve:
- Linear Bézier curves
- Note: "P0" and "P1", etc., simply stand for Points 0 and 1.
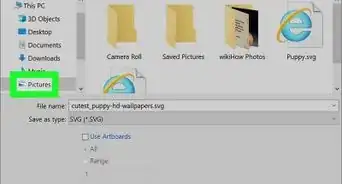
- Given Points P0 and P1, a linear Bézier curve is simply a straight line between those two Points.
- The curve is given by B(t) = P0 + t*(P1 - P0) = (1-t)*P0 + t*P1, where t is an element in the range [0,1], inclusive, and is equivalent to linear interpolation.
- Enter the sub headers and formulas which create the chart:
- Enter t to cell A11; enter X P0 to cell B11; enter Y P0 to cell C11; enter X P1 to cell D11; enter Y P1 to cell E11; enter (1-t)*P0 + t*P1 to cell K11 and also to cell L11;
- Enter .4 to cell A12; enter 2 to cell B12; enter 2 to cell C12; enter 4 to cell D12; enter 3 to cell E12; enter to cell K12, w/o quotes, the formula "=(1-t)*Psub0_X+t*Psub1_X" and Format Cells Font Red [Result=2.8]; enter to cell L12, w/o quotes, the formula "=(1-t)*Psub0_Y+t*Psub1_Y" and Format Cells Font Red [Result=2.4];
- Enter Chart data:
- Enter to cell M10 w/o quotes "Linear Bézier curve";
- Enter to cell N10 X;
- Enter to cell O10 Y;
- Enter to cell M11 P0;
- Enter to cell M12 B(t);
- Enter to cell M13 P1;
- Enter to cell M14 t;
- Copy Interpolater from cell K1 and paste it to cell M15;
- Enter to cell N11 w/o quotes the formula, "=B12";
- Enter to cell O11 w/o quotes the formula, "=C12";
- Enter to cell N12 w/o quotes the formula, "=K12";
- Enter to cell O12 w/o quotes the formula, "=L12";
- Enter to cell N13 w/o quotes the formula, "=D12";
- Enter to cell O13 w/o quotes the formula, "=E12";
- Enter to cell N14 w/o quotes the formula, "=A12";
- Enter to cell N15 w/o quotes the formula, "=Interpolater";
-
3Create the Linear Bézier Curve Chart
- Select cell range N11:O13;
- Select Chart from the Ribbon and select Scatter, Smoothed Line Scatter -- a chart should appear on your worksheet;
- Move the chart by selecting inside the border and place its upper left corner at the upper left of cell N2; Resize the chart by hovering over the lower right corner until the cursor changes to a double-headed arrow, then grab the corner and fit the corner to the lower right corner of cell P9;
- Click on the line in the chart and edit the data series in the formula bar so that it reads as follows, "=SERIES("Bézier Line",Sheet1!$N$11:$N$13,Sheet1!$O$11:$O$13,1);
- Click on the chart line and do menu Format Data Series to bring that dialog box;
- Set Marker Fill to Red; Set Marker Style to Circle, 7 pts;
- Click inside the border of the chart area, but not on any object, and do Chart Source Data;
- Click on the Series Add button and for Name, enter B(t) Marker (or Initial Interpolation);
- Click on the middle Data Marker and do Menu Format Data Series -- Marker Style, Round, 10 pt, then do Marker Fill Red; OK;
- Click on Chart Layout in the Ribbon and set Axes, Vertical Axis, Axes Options, Number, Uncheck Linked to Source and set Number to 0.00; OK;
- Do it again but this time set Line to 3 pt;
- Do the same last two steps for the Horizontal axis;
- Choose the icon Axis Titles and, by using the Text option and going Home on the Ribbon and coming back, set both titles at 18 Point font in black, with the vertical axis Vertical (text orientation);
- Click on the Legend, then Home, and then the Bold icon.
- Your chart should now resemble this one, except that I did Copy Picture including the data section and did Paste Picture onto the 'Saves' worksheet, then copied that and opened it in Preview in order to save it as a jpg file:

Do Quadratic Bezier Curve
-
1Familiarize yourself with the basic facts of the Quadratic Bézier Curve:
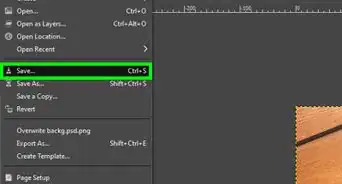
- A quadratic Bézier curve is the path traced by the function b(t), given points P0, P1 and P2.
- B(t) = (1-t)*[(1-t)P0+t*P1] + t*[(1-t)*P1 + P2], where t is an element in the range [0,1], inclusive, which can be interpreted as the linear interpolant of corresponding points in the linear Bézier curves from P0 to P1 and from P1 to P2 respectively.
- Rearranging the preceding equation algebraically gives:
- B(t) = (1-t)^2*P0 + 2*(1-t)*t*P1 + t^2 * P2, where t is an element in the range [0, 1], inclusive.
- The derivative of the Bézier curve with respect to t is
- B´(t) = 2*(1-t)*(P1 - P0) + 2*t*(P2 - P1), from which it can be concluded that the tangents to the curve at P0 and P2 intersect at P1.
- As t increases from 0 to 1, the curve departs from P0 in the direction of P1, then bends to arrive at P2 from the direction of P1.
- The second derivative of the Bézier curve with respect to t is:
- B´´(t) = 2*(P2 - 2*P1 + P0].
- A quadratic Bézier curve is also a parabolic segment. As a parabola is a conic sector, some sources refer to quadratic Béziers as "conic arcs".
- Enter the sub headers and formulas which create the chart:
- Enter t to cell A34; enter X P0 to cell B34; enter Y P0 to cell C34; enter X P1 to cell D34; enter Y P1 to cell E39; enter X P2 to cell F34; enter Y P2 to cell G34; enter ((1-t)^2+(1-t)t*P1+t^2* P2)*Interpolater to cell K39 and also to cell L39;
- Enter .2 to cell A35; enter 1 to cell B35; enter 3 to cell C35; enter 2 to cell D35; enter 1.5 to cell E35; enter, w/o quotes, "=A35" to cell A40; copy cell A40 and paste it to cell range B40:G40; enter to cell K40, w/o quotes, the formula "=((1-t)^2+(1-t)*t*Psub1_X+t^2*Psub2_X)*Interpolater" and Format Cells Font Red [Result=1.2280]; enter to cell L40, w/o quotes, the formula "=((1-t)^2+(1-t)*t*Psub1_Y+t^2*Psub2_Y)*Interpolater" and Format Cells Font Red [Result=1.0400](given the Interpolater = 1);
-
2Enter the Quadratic Chart data:
- Enter to cell N32 X;
- Enter to cell O32 Y;
- Enter to cell M33 P0;
- Enter to cell M34 P1i;
- Enter to cell M35 P2;
- Enter to cell M36 t;
- Enter to cell M37 Interpolater: ;
- Enter to cell N33 "=B35" w/o quotes;
- Enter to cell N34 "=D40*Interpolater" w/o quotes;
- Enter to cell N35 "=F40" w/o quotes;
- Enter to cell N36 "=A35" w/o quotes;
- Enter to cell N37 "=Interpolater" w/o quotes;
- Enter to cell O33 "=C35" w/o quotes;
- Enter to cell O34 "=E40*Interpolater" w/o quotes;
- Enter to cell O35 "=G40" w/o quotes;
- Select cell range M33:O35 and Format Cells Border Black Bold Outline Top Bottom and Sides but not the Middle bar.
- Enter to cell M39 P0;
- Enter to cell M40 B(t)*Interp;
- Enter to cell M41 P2;
- Enter to cell N39 "=B40" w/o quotes;
- Enter to cell N40 "=K40" w/o quotes;
- Enter to cell N41 "=F35" w/o quotes;
- Select cell range E40:O40 and Format Cells Font Red;
- Select cell range M39:O41 and Format Cells Border Red Dashed Line (long dash) and do Border All selection icon.
-
3Create the Quadratic Curve Chart:
- Select cell range N13:O15 and use the Chart item on the Ribbon, or Chart Wizard, or whatever to select Charts - All, Scatter, Smoothed Line Scatter; at this Point, a chart should appear atop your worksheet;
- Select inside the border but not on any chart object and do menu item Chart Source Data;
- For Series#1, title it P0, P1i, P2; set X-series to $N$33:$N$35 and set Y-series to $033:$O$35;
- Hit OK and go back to the same dialog box via Chart Source Data;
- For Series#2, title it P0, B(t)i, P2; set X-series to $N$39:$N$41 and set Y-series to $039:$O$41;
- These steps may not turn out right: Check by clicking on the first data series that its formula in the formula bar reads,
- "=SERIES("P0, P1i, P2", Sheet1!$N$33:$N$35,Sheet1!$O$33:$O$35,1)"
- and that the formula in the formula bar for the second data series reads,
- "=SERIES("P0, B(t)i, P2",Sheet1!$N$39:$N$41,Sheet1!$O$39:$O$41,2)", w/o quotes.
- Format the Axes, Vertical Gridlines and Axes Titles as you did for the Linear Chart above;
- Do Chart Layout, Chart Title, Format Title, Text Box and check Resize shape to fit text;
- Edit-click in the new Text-Box title box and title the chart Bézier Quadratic Curve (return) P0, P1i, P2 and P0, B(t)i, P2; OK.
- Drag the chart so that its upper left corner is in cell M19 and resize it so its lower right corner is in cell Q31.
- Except for some Data Marker Styles and Fill and perhaps a few other details, your chart should resemble this one:

Do Cubic Bezier Curve
-
1Familiarize yourself with the basic facts of the Cubic Bézier Curve:
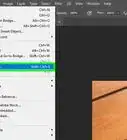
- Four points P0, P1, P2 and P3 in the plane or in a higher dimensional space define a cubic Bézier curve.
- The curve starts at P0 going toward P1 and arrives at P3 coming from the direction of P2. Usually, it will not pass through P1 or P2; these points being there only to provide directional information.
- The distance between P0 and P1 determines "how long" the curve moves into direction P2 before turning towards P3.
- Writing BPiPjPk(t) for the quadratic Bézier curve defined by points Pi, Pj and Pk, the cubic Bézier curve can be defined as a linear combination of two quadratic Bézier curves.
- B(t) = (1-t)*BP0,P1,P2(t) + t*BP1,P2,P3(t), with t as an element in the range [0, 1], inclusive.
- For some choices of P1 and P2, the curve may intersect itself, or contain a cusp.
- Any series of 4 distinct points can be converted to a cubic Bézier curve that goes through all 4 points in order.
- Given the starting and ending point of some cubic Bézier curve, and the points along the curve corresponding to t = 1/3 and t = 2/3, the control points for the original Bézier curve can be recovered.
- The derivative of the cubic Bézier curve with respect to t is
- B´(t) = 3*(1-t)^2 * [P1 - P0] + 6*(1-t)*t*(P2 - P1) + 3*t^2 *(P3 - P2).
- The second derivative of the Bézier curve with respect to t is:
- B´´(t) = 6*(1-t)*(P2 - 2*P1 + P0) + 6*t*(P3 - 2*P2 + P1).
- Enter the sub headers and formulas that create the chart:
- Enter t to cell A71; enter X P0 to cell B71; enter Y P0 to cell C71; enter X P1 to cell D71; enter Y P1 to cell E71; enter X P2 to cell F71; enter Y P2 to cell G71;
- Enter ((1-t)^3*P0+3*(1-t)^2*t*P1+3*(1-t)*t^2*P2+t^3* P3)*Interpolater to cells K71, L71, K76, L76, K82 and L82;
- Enter .5 to cell A72; enter -3 to cell B72; enter -4 to cell C72; enter -.5 to cell D72; enter 1 to cell E72; enter -1 to cell F72; enter 3 to cell G72; enter 4 to cell H72; enter 1 to cell I72;
- Enter, w/o quotes, "=1/3" to cell A77; enter, w/o quotes, "=B72" to cell B77 and copy cell B77 and paste it to cell range C77:I77;
- Enter, w/o quotes, "=2/3" to cell A83; enter, w/o quotes, "=B77" to cell B83 and copy cell B83 and paste it to cell range C83:I83;
- Enter in cell A85, the text w/o quotes, "For further information, see:" and enter in cell A86 http://en.wikipedia.org/wiki/B%C3%A9zier_curve which then step into in the formula bar and edit it at the middle/end of it, adding nothing, press return, and it should become a live link;
- Enter to cell K72, w/o quotes, the formula "=((1-t)^3*Psub0_X+3*(1-t)^2*t*Psub1_X+3*(1-t)*t^2*Psub2_X+t^3*Psub3_X)*Interpolater" and Format Cells Font Red [Result=-0.8125]; copy this same formula and paste it to cells K77 and K83 [where the results are -1.2963 and -0.3704, respectively];
- Enter to cell L72, w/o quotes, the formula "=((1-t)^3*Psub0_Y+3*(1-t)^2*t*Psub1_Y+3*(1-t)*t^2*Psub2_Y+t^3*Psub3_Y)*Interpolater" and Format Cells Font Red [Result=+1.1250]; copy this same formula and paste it to cells L77 and L83 [where the results are -0.0370 and +1.7037, respectively];
-
2Enter the Chart data section:
- Enter t into cell M70;
- Enter Pt# into cell N70 -- (not done in the image below);
- Enter X into cell O70;
- Enter Y into cell P70;
- Select cell range M70:O70 and Format Cells Font Bold Size 18;
- Enter to cell M72 the formula, "=t"; copy that formula and paste it to cells M77 and M83;
- Enter P0 and make 0 a subscript in cell N71. Copy cell N71 and paste it to cell range N72:N84;
- You want to have 3 series of 4 digits each, separated by 2 spaces between the series. Edit Series 1 from N71 to N74 so that the P's subscripts read 0, 1i, 2, 3; Delete the entry in cell N75, and edit Series 2 from N76 to N79 so that the P's subscripts read 0,1i, 2, 3; Delete the entry in cell N80, and edit Series 3 from N81 to N84 so that the P's subscripts read 0,1, 2i, 3;
- Copy from cell K1 the label Interpolater: and paste it to cell R71; Enter to cell S71 the formula, w/o quotes, "=Interpolater", (stripping off the colon and extra space first if you copied it from R71);
- Format Cells Border Red Bold Surrounding Box to cell range Q71:S71 and use the Paint bucket tool in the Toolbar to fill the cell range Q72:S72 with a band of bright red.
- Enter to cell O71 the formula w/o quotes, "=B72" and enter to cell P71 "=C72";
- Enter to cell O72 the formula w/o quotes, "=K72" and enter to cell P72 "=L72";
- Enter to cell O73 the formula w/o quotes, "=F72" and enter to cell P73 "=G72";
- Enter to cell O74 the formula w/o quotes, "=H72" and enter to cell P74 "=I72";
- Enter to cell O76 the formula w/o quotes, "=B77" and enter to cell P76 "=C77";
- Enter to cell O77 the formula w/o quotes, "=K77" and enter to cell P77 "=L77";
- Enter to cell O78 the formula w/o quotes, "=F77" and enter to cell P78 "=G77";
- Enter to cell O79 the formula w/o quotes, "=H77" and enter to cell P79 "=I77";
- Enter to cell O81 the formula w/o quotes, "=B83" and enter to cell P81 "=C83";
- Enter to cell O82 the formula w/o quotes, "=D83" and enter to cell P82 "=E83";
- Enter to cell O83 the formula w/o quotes, "=K83" and enter to cell P83 "=L83";
- Enter to cell O84 the formula w/o quotes, "=H83" and enter to cell P84 "=I83";
- Format cells fill yellow and font red for the Shift and Command cell range selection wherever there is an i in the P subscript, for the X and Y values only, i.e. cell range O72:P72+O77:P77+O83:P83.
-
3Create the Bézier Cubic Curve Chart:
- Select cell range O71:P74 and create a new Chart via the Chart option on the Ribbon or from the toolbar or menu; select All, Scatter, Smoothed Line Scatter ... and a chart should appear atop your worksheet with a curve on it. Double-click on the curve and edit the title in the front of the series formula in the formula bar until the formula reads, "=SERIES("Cubic Curve",Sheet1!$O$71:$O$74,Sheet1!$P$71:$P$74,1)", w/o quotes externally.
- Click inside the chart but not on any chart object once and select menu Chart Source Data;
- Below the Series box, click the Add button, then enter the name: ="Control Point 01"; then for the X values, select on your sheet or type in =Sheet1!$O$76:$O$79 and for the Y values select on your sheet or type in =Sheet1!$P$76:$P$79 -- hit OK and verify in the formula bar that the series formula is correct. You should have a second curve; double click on it and format chart series Line Red Weight 5 Dashed line; OK.
- Double click in the plot area, Again below the Series box, click the Add button, then enter the name: ="Control Point 02"; then for the X values, select on your sheet or type in =Sheet1!$O$81:$O$84 and for the Y values select on your sheet or type in =Sheet1!$P$81:$P$84 -- hit OK and verify in the formula bar that the series formula is correct. You should have a second curve; double click on it and format chart series Line Green Weight 4 Tiny Dashes line;
- Now add the series name ="Control Point Marker #00" with X values =Sheet1!$K$72 and Y values =Sheet1!$L$72 and Format that series or data Point as a big blue-filled style round dot.
- Now add the series name ="Control Point Marker #01" with X values =Sheet1!$K$77 and Y values =Sheet1!$L$77 and Format that series or data Point as a big red-filled style round dot.
- Now add the series name ="Control Point Marker #02" with X values =Sheet1!$K$83 and Y values =Sheet1!$L$83 and Format that series or data Point as a big green-filled style round dot.
- Select the chart and the chart data underneath it by selecting the cell range that includes them, once you've repositioned the chart over the chart data properly to extend from upper left cell 1/2 of M49 to lower right the left quarter of cell T69, and hold the Shift key down and do Edit Copy Picture, activate the Saves worksheet and hold down the Shift Key again and do Paste Picture, Do Copy via command and v, and open the app Preview and do File New from Clipboard. Export it as a .jpg or .png file into your same folder so you can easily send it to friends or keep it with your photos, etc.
- Here are the versions created for this article with Interpolate set to 1.4 and 1: