X
wikiHow is a “wiki,” similar to Wikipedia, which means that many of our articles are co-written by multiple authors. To create this article, 10 people, some anonymous, worked to edit and improve it over time.
The wikiHow Tech Team also followed the article's instructions and verified that they work.
This article has been viewed 805,328 times.
Learn more...
Excel is a great option for running multiple regressions when a user doesn't have access to advanced statistical software. The process is fast and easy to learn.
Steps
-
1Open Microsoft Excel.
-
2Check to see if the "Data Analysis" ToolPak is active by clicking on the "Data" tab. If you don't see the option, you will need to enable the add-in, as follows:
- Open the "File" menu (or press Alt+F) and select "Options"
- Click "Add-Ins" on the left side of the window
- Click "Go" next to the "Manage: Add-ins" option at the bottom of window
- In the new window, check the box next to "Analysis ToolPak", then click "OK"
- The add-in is now enabled
Advertisement -
3Enter your data, or open your data file. Data must be arranged in immediately adjacent columns and labels should be in the first row of each column.
-
4Select the "Data" tab, then click "Data Analysis" in the "Analysis" grouping (most likely at or near the far right of Data tab options).
-
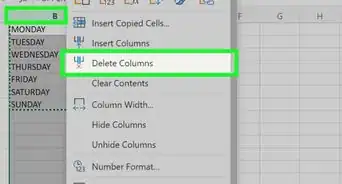
5Input the dependent (Y) data by first placing the cursor in the "Input Y-Range" field, then highlighting the column of data in the workbook.
-
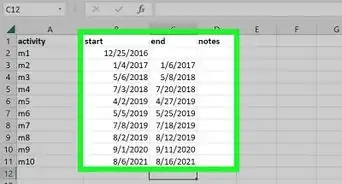
6The independent variables are entered by first placing the cursor in the "Input X-Range" field, then highlighting multiple columns in the workbook (e.g. $C$1:$E$53).
- NOTE: The independent variable data columns MUST be adjacent one another for the input to occur properly.
- If you are using labels (which should, again, be in the first row of each column), click the box next to "Labels".
- The default confidence level is 95%. If you wish to change this value, click the box next to "Confidence Level" and modify the adjacent value.
- Under "Output Options", add a name in the "New Worksheet Ply" field.
-
7Select the desired options in the "Residuals" category. Graphical residual outputs are created by with the "Residual Plots" and "Line Fit Plots" options.
-
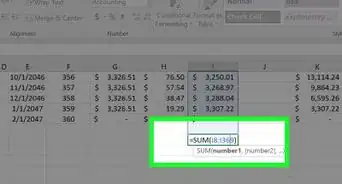
8Click "OK" and the analysis will be created.


Advertisement
Expert Q&A
-
Questionwhat is output range
 Kyle SmithKyle Smith is a wikiHow Technology Writer, learning and sharing information about the latest technology. He has presented his research at multiple engineering conferences and is the writer and editor of hundreds of online electronics repair guides. Kyle received a BS in Industrial Engineering from Cal Poly, San Luis Obispo.
wikiHow Technology WriterThe output range in the regression window is where the results of the analysis will appear. This can be in an existing sheet, a new sheet, or an entirely new workbook file. -
Questiongetting #NUM error p- values. What does it mean?Kyle SmithKyle Smith is a wikiHow Technology Writer, learning and sharing information about the latest technology. He has presented his research at multiple engineering conferences and is the writer and editor of hundreds of online electronics repair guides. Kyle received a BS in Industrial Engineering from Cal Poly, San Luis Obispo.
wikiHow Technology WriterThis could indicate that you don't have enough observations to compute the significance of the model or its parameters. Try adding additional observations if this is the case. -
QuestionWhat is the formula of multiple regression used by Excel in the background?Kyle SmithKyle Smith is a wikiHow Technology Writer, learning and sharing information about the latest technology. He has presented his research at multiple engineering conferences and is the writer and editor of hundreds of online electronics repair guides. Kyle received a BS in Industrial Engineering from Cal Poly, San Luis Obispo.
wikiHow Technology WriterExcel is using the linear regression formula y = m1x1 + m2x2 + ... + b. It calculates the values using the least squares method.
Advertisement


About This Article
Advertisement