This article was co-authored by wikiHow staff writer, Christopher M. Osborne, PhD. Christopher Osborne has been a wikiHow Content Creator since 2015. He is also a historian who holds a PhD from The University of Notre Dame and has taught at universities in and around Pittsburgh, PA. His scholarly publications and presentations focus on his research interests in early American history, but Chris also enjoys the challenges and rewards of writing wikiHow articles on a wide range of subjects.
This article has been viewed 3,367 times.
Learn more...
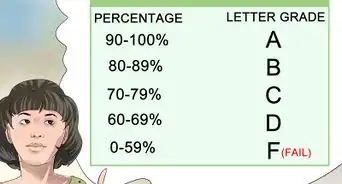
Class width is a key component of a frequency distribution table. A good example of a frequency distribution table is a teacher recording how many students earned A’s (90+), B’s (80-89), C’s (70-79), etc., on a test. Establishing a class width gives the groups equal parameters (in the example above, it’s 10—e.g., 70, 80, 90). Confused? Don’t worry! We’ll show you how simple it is to determine class width for use in a frequency distribution table.
Things You Should Know
- Determine the range of a set of numbers by subtracting the smallest from the largest.
- Calculate class width by dividing the range by the number of groups. In formula form, it’s (max-min)/n . "(max-min)" = the range and n = the number of groups.
- If the calculated class width isn’t a whole number, round up.
- Use class width to create classes with equal parameters (e.g., 60-69, 70-79) when sorting items into a frequency distribution table.
Steps
Finding and Using Class Width
-
1Subtract the smallest from the largest item to get the range. An item is each number you have in a group—for example, each number grade in a set of test scores. Determine the range—the gap between the smallest and largest items—by subtracting the smallest from the largest. For instance:[2]
- Items (e.g., grades): 64, 68, 73, 75, 78, 79, 81, 83, 83, 84, 89, 90, 91, 94, 96, 97
- Largest item (97) minus smallest item (64): 97-64=33
- Range: 33
-
2Select between 5 and 20 classes (groups) to sort the items into. There’s no hard-and-fast rule on the number of classes to break a set of items into. A very general guide, though, is to use 5 groups for 20 or fewer items, and 20 groups for 100 or more items. Ideally, each group will end up with at least 1 item in it. Some people also prefer to use an odd number of classes (5, 7, 9, etc.), so that there’s always a class that serves as the midpoint (class 3 in a 5-class setup, etc.).[3]
- In our example of number grades, there are 16 items. Since this is fewer than 20 items, we’ll follow the “rule of thumb” and use 5 classes.
-
3Divide the range by the classes (and round up) to get class width. Using our example, our range is 33 and our number of classes is 5. While 33/5=6.6, it’s standard procedure to round up to the next whole number; in this case, 7. Therefore, the class width is 7. (Strictly speaking, you’re done calculating class width at this point, but we’ll keep going to fill out the classes in a frequency distribution table.)[4]
- You’ll often see the “class width formula” defined as (max-min)/n, with “(max-min)” representing the range calculation and “n” referring to the number of classes.
-
4Start the first class at the smallest item. Using our example, 64 is the smallest item (lowest number) in the set. So, assuming that you want the class width to be equal for each class, set the low parameter for the first class at 64.[5]
- NOTE: In some cases you may prefer for the first (lowest) and/or last (highest) classes to extend beyond the smallest or largest item. You might, for example, want the first class to start at 60 (or even 0) instead of 64, and the last class to end at 100. This is generally fine to do if it suits your needs.
-
5Add the class width and subtract 1 to end the first class. Recall that class width is the difference between the starting points of consecutive classes. So adding the class width to the starting point of the first class gives you the starting point of the second class. To get the end point of the first class, simply subtract 1. Here’s how it looks in our example:[6]
- The first class starts at 64. 64+7 (class width) =71 (start of second class).
- Since 71-1=70, the first class includes all items between 64 and 70.
- NOTE: If you choose to start the first class at 60, 0, or any other number, be sure to do this calculation with 64 as your starting point.
-
6Add 1 to the end of the first class to start the second class. We want the second class to begin at the next whole number past the end of the first class, and adding 1 easily does the trick. Since the first class in our example runs from 64 to 70, the second class begins at 71.[7]
-
7Keep repeating the process to create all the classes. Using our example, the second class starts at 71 and ends at 78 (71+7-1=77). This is how the entire set of classes will look:[8]
- 64-70
- 71-77
- 78-84
- 85-91
- 92-98
-
8Place each item into its correct class. Now that we’ve set up the parameters of the 5 classes, we can populate them with our example’s set of items (64, 68, 73, 75, 78, 79, 81, 83, 83, 84, 89, 90, 91, 94, 96, 97). Here’s the result:[9]
- 64-70: 2 items (64, 68)
- 71-77: 2 items (73, 75)
- 78-84: 6 items (78, 79, 81, 83, 83, 84)
- 85-91: 3 items (89, 90, 91)
- 92-98: 3 items (94, 96, 97)
- Note: If you’re asked to calculate the relative frequency for the items in each group, divide the number of items in each group by the total number of items. For example, the relative frequency for the first group is 2/16 or 0.125.
Sample Problem
-
1Find the range of the given list of items. For this example, we’ll use the following list of 22 items: 8, 11, 17, 21, 22, 30, 35, 37, 40, 42, 44, 46, 55, 57, 63, 69, 71, 75, 78, 79, 84, 88. To calculate the range, subtract the smallest (8) from the largest (88) item:
- 88-8=80
-
2Set the number of classes you’ll use. Remember that it’s most common to use somewhere between 5 and 20 classes, but that there are no set-in-stone rules here. In this case, let’s say that we want to assign tasks related to these 22 items to 7 groups of students, and therefore decide to set the number of classes at 7.
-
3Divide the range by the classes and round up for the class width. Since our range is 80 and we’re using 7 classes, the calculation sets up like this: 80/7=11.4. However, remember that it’s common practice to round up to the next whole number, making our class width 12.
-
4Set the start and end of the first class. While we could start the first class at 0 if desired, we’ll keep all the class widths equal by starting at the lowest item: 8. Add the class width (12) to this number and then subtract 1 to get the endpoint of the first class:
- 8+12-1=19, so the first class goes from 8 to 19.
-
5Set the remaining classes. Repeating the process from above, we end up with the following parameters for the 7 classes:
- 8-19
- 20-31
- 32-43
- 44-55
- 56-67
- 68-79
- 80-91
-
6Populate the classes with the items. Using our list of 22 items (8, 11, 17, 21, 22, 30, 35, 37, 40, 42, 44, 46, 55, 57, 63, 69, 71, 75, 78, 79, 84, 88), we end up with the following data for our frequency distribution table:
- 8-19: 3 items (8, 11, 17)
- 20-31: 3 items (21, 22, 30)
- 32-43: 4 items (35, 37, 40, 42)
- 44-55: 3 items (44, 46, 55)
- 56-67: 2 items (57, 63)
- 68-79: 5 items (69, 71, 75, 78, 79)
- 80-91: 2 items (84, 88)
References
- ↑ http://www.math.utah.edu/~anna/Sum12/LessonPlans/Section21.pdf
- ↑ http://www.math.utah.edu/~anna/Sum12/LessonPlans/Section21.pdf
- ↑ https://people.richland.edu/james/lecture/m170/ch02-grp.html
- ↑ https://youtu.be/MVQRgt7a2kk?t=92
- ↑ https://youtu.be/MVQRgt7a2kk?t=127
- ↑ http://www.math.utah.edu/~anna/Sum12/LessonPlans/Section21.pdf
- ↑ http://www.math.utah.edu/~anna/Sum12/LessonPlans/Section21.pdf
- ↑ https://people.richland.edu/james/lecture/m170/ch02-grp.html
- ↑ http://www.math.utah.edu/~anna/Sum12/LessonPlans/Section21.pdf


