This article was co-authored by wikiHow Staff. Our trained team of editors and researchers validate articles for accuracy and comprehensiveness. wikiHow's Content Management Team carefully monitors the work from our editorial staff to ensure that each article is backed by trusted research and meets our high quality standards.
There are 10 references cited in this article, which can be found at the bottom of the page.
wikiHow marks an article as reader-approved once it receives enough positive feedback. In this case, 97% of readers who voted found the article helpful, earning it our reader-approved status.
This article has been viewed 144,540 times.
Learn more...
Nautical charts are an important navigational tool even when you’re familiar with a waterway. A nautical chart helps you figure out which way to go, how deep the water is, and the location of harbors. You will also know about underwater obstructions that may not be visible and overhead bridges and power lines that could get in your way. Even if you have an onboard navigation system, chart reading is a skill you need to know before going out onto the water.
Steps
Measuring Distance and Depth
-
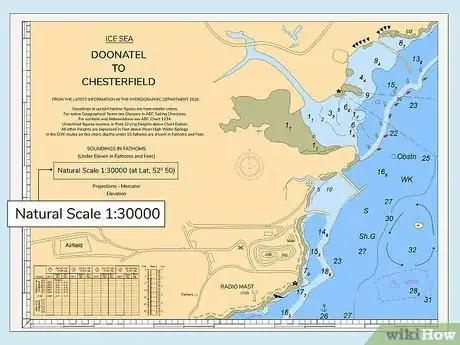
1Use the scale indicator to track distance on a chart. Scales are expressed as ratios and differ from map to map. The scale, printed in the upper right corner of the map, will look something like 1:100,000. A ratio of 1:10,000 indicates that every 1 in (2.5 cm) the map equals 10,000 in (25,000 cm) in the real world. Charts with smaller scales provide an up-close view, depicting more area details and markers.[1]
- If you’re familiar with land maps, the scale works the same way there.
- A harbor chart is an example of a small scale chart. Navigators need a close view of the harbor with all the obstructions and other details. Larger charts show land and waterways but few additional details.
-
2Find the unit of measurement used to indicate water depth. Look in the upper right corner of the map near the scale. You will see the unit of measurement printed in big letters. You need to know this because charts use all sorts of different measurements. Your chart could include feet, fathoms, or meters.[2]
- In the U.S., charts generally use feet or fathoms. However, the National Oceanic and Atmospheric Administration (NOAA) has begun converting its charts to meters for the sake of international consistency.
Advertisement -
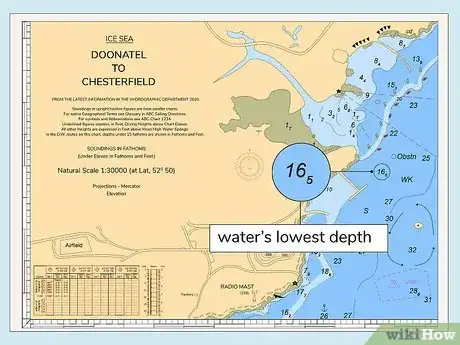
3Read the chart numbers to figure out the water’s lowest depth. The black numbers printed on the chart represent water depth. Each number indicates the “mean lower low water” (MLLW) in an area. This is the average water depth at low tide, so most of the time the water is deeper than what you see on a chart.[3]
- If you see a negative number, that means the water depth in the area is typically less than what is listed on the chart.[4]
-
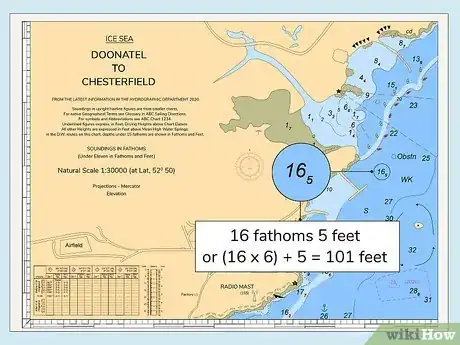
4Multiply fathoms by 6 to measure depths by feet. Numbers written in fathoms have a unique look to them, so they are easy to spot. A fathom listing often consists of a pair of numbers. The first number indicates the number of fathoms. The second number, which will be a small subscript, is the number of additional feet.[5]
- For example, a listing of 0 and 3 means a depth of 0 fathoms, 3 feet. A listing of 3 and 2 means 3 fathoms, 2 feet, or 20 feet total.
-
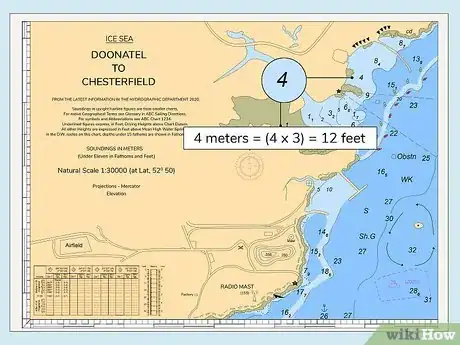
5Multiply meter measurements by 3 to convert them to feet. For uniformity and simplicity, many modern charts use meters. This can be tough to understand if you’re used to measurements in feet or fathoms. Multiplying by 3 is a quick way to get a relatively accurate estimate of the water’s depth.[6]
- For example, multiply a listing of 6 meters by 3 to estimate it as being at least 18 feet deep. The actual depth is 6 metres (20 ft), so it isn’t completely accurate, but it is helpful for avoiding shallow areas.
- If the depths are listed in feet, you can also divide them by 3 to quickly convert them to meters.
Using Colored Contour Lines
-
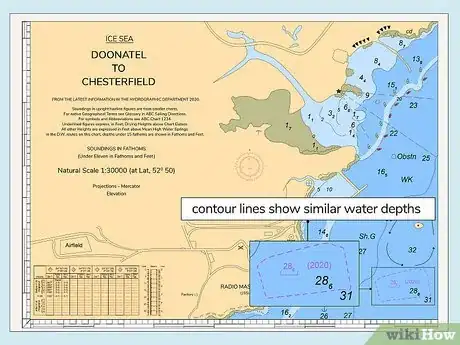
1Follow dotted contour lines to monitor similar water depths. Contour lines are there to give you an idea of what is happening beneath the water’s surface. Contour lines, often red, connect similar water depth listings. This has the effect of dividing areas into shallower and deeper waters. Use the contour lines as a reference for the overall water depth in an area.[7]
- For example, contour lines may connect points listed as 20 ft (240 in) deep. All of the points inside those lines are even shallower than that.
-
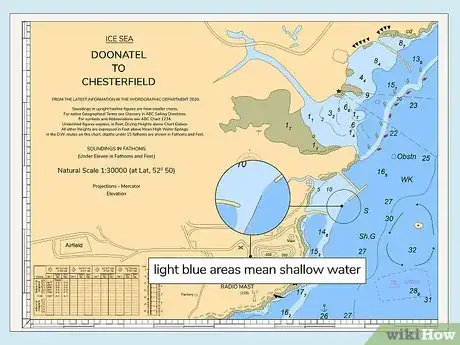
2Look for light blue areas to identify shallow water. On nautical charts, white space is normally water, so the blue areas will stand out more. Shoals and other shallow areas are blue. These spots tend to be no more than 18 ft (5.5 m) deep, although this varies from chart to chart. Shallow areas are often marked off by contour lines.[8]
- The exact depth of shallow areas depends on the chart. Some charts color in areas under 3 fathoms, while others mark spots less than 1 fathom deep.
-
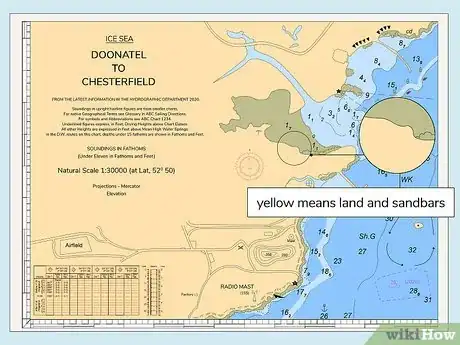
3Find yellow or tan areas to identify land and sandbars. Dry land will usually be inside a contour line, but not always. Pay particular attention to any tan spots in the middle of water channels. Sometimes these spots are submerged and can damage your boat, especially in shallow water.
- Land is always a light color to distinguish it from water and other navigational aids.
Identifying Common Chart Symbols
-
1Use the compass rose to identify the direction you are traveling. The compass rose is a series of 3 circles surrounded by numbers. The outer circle is to help you find true north, represented by a star or 0. The inner circle points to the magnetic north pole at the time of the chart’s printing. You can use a magnetic compass to navigate with the compass rose as a guide.[9]
- Keep in mind that the magnetic field over the Earth changes over time, so you will need a magnetic compass or an updated map to make use of the compass rose.
-
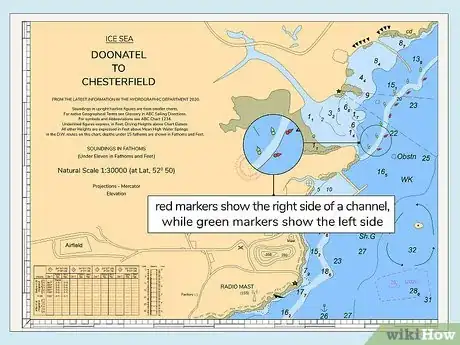
2Follow red and green buoys for navigational guides. These buoys mark water channels. The colored circles you see on a chart correspond to buoys you will see floating along the channels as you travel. Travel markers are numbered, making tracking your route easy.[10]
- Red markers show the right side of a channel, while green markers show the left side. The different colors keep you oriented no matter which way you travel.
-
3Look for anchors to find anchoring points for boats. The anchor is a familiar symbol on charts showing waterways close to land. An anchor means you can let down your boat’s anchor safely in that area. Anchoring points may be labeled with numbers or descriptions to describe what kind of boats are allowed to stay there.
- For example, an anchor point marked “DW” means deep water. Only deepwater vessels will anchor there.
- A number like 24 stands for 24 hours, so you can only keep your boat in the area for a day at a time.
-
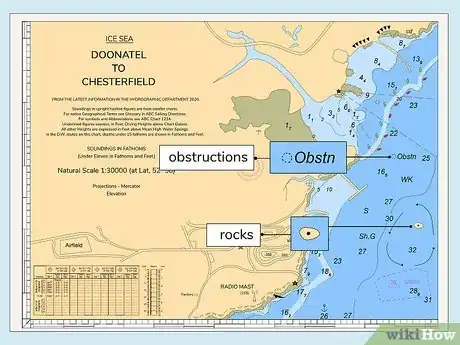
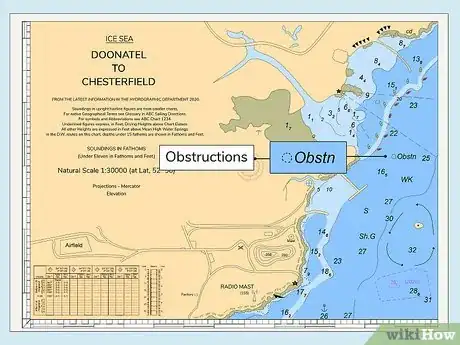
4Note rocks and other dangers circled on the map. Dangerous obstacles like rocks and shipwrecks are all circled. Some circles are dotted, meaning that the obstacles are submerged. If the lines are solid, the obstacles are at least partially above the water. Many modern charts now mark these spots in purple.[11]
- Obstacles are generally represented by circles with symbols like asterisks and plus signs. There are many different symbols and they often vary between charts.
- Some charts use picture symbols, such as a boat to represent a partially-sunken shipwreck.
-
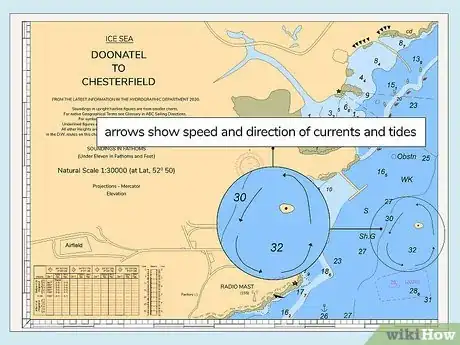
5Follow arrows for the speed and direction of currents and tides. Currents are indicated by arrows with numbers over them. The direction of the arrow tells you which way the current moves. The number lets you know the water speed in knots.[12]
- Currents and tides change all the time. Take the arrows as a prediction for the way water normally flows. Keep watch as you travel for anything out of the ordinary.
-
6Read abbreviations to identify important features in the area. Since charts have a limited amount of space, mapmakers have to rely on abbreviations to label markers. Some letters indicate the type of seafloor. Others label landmarks like towers, wharves, and government stations.
- Some common seafloor abbreviations include S for sand, M for mud, and C for coral. Rky stands for a rocky floor.
- Tr indicates a nearby tower, while Whf stands for wharf and Bn means beacon. CG may indicate a Coast Guard station on a U.S. map.
-
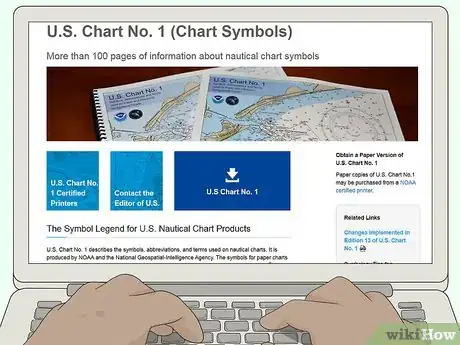
7Download a separate chart for a list of less common symbols. The full title of the chart is NOS Chart No. 1: Symbols, Abbreviations, and Terms. It isn’t actually a sea chart, but it contains a list of all the chart symbols you may encounter. Download it from the NOAA’s website or purchase a copy from a commercial chart vendor.[13]
- The chart covers all U.S. charts. Download a copy at https://nauticalcharts.noaa.gov/publications/us-chart-1.html.
- Charts made in other countries may have different symbols. Check with your government’s maritime office for a reference.
Warnings
- Listen to weather reports before sailing. Storms and other types of weather can have serious effects on waterways, including changes to the water depth you see listed on a chart.⧼thumbs_response⧽
- Waterways change over time, so don’t rely on old charts. You may miss out on new wrecks, power lines, bridges, water depth changes, and other issues that can get you into trouble.⧼thumbs_response⧽
References
- ↑ http://www.coastalnavigation.com/samples/sec_1/1_pages/1_3.htm
- ↑ https://nauticalcharts.noaa.gov/publications/docs/national-charting-plan.pdf
- ↑ https://www.uscg.mil/Portals/0/OurOrganization/auxiliary/publications/auxmanuals/ATON2000StudyGuideSec7NauticalCharts.pdf?ver=2017-07-02-093515-587
- ↑ http://www.boatus.com/boattech/casey/chart-reading101.asp
- ↑ http://www.boatus.com/boattech/casey/chart-reading101.asp
- ↑ https://www.rapidtables.com/convert/length/meter-to-feet.html
- ↑ https://oceanservice.noaa.gov/facts/sounding.html
- ↑ https://www.getmyboat.com/resources/tips-for-renters/139/how-nautical-charts-are-read/
- ↑ https://www.garykessler.net/scuba/library/Charts_Navigation.pdf
