X
wikiHow is a “wiki,” similar to Wikipedia, which means that many of our articles are co-written by multiple authors. To create this article, 22 people, some anonymous, worked to edit and improve it over time.
This article has been viewed 69,537 times.
Learn more...
This article is meant to give new users to MATLAB a basic introduction to graphing data. It is not meant to cover every detail of graphing in MATLAB, but should cover enough to get you started. This introduction assumes no previous experience in programming and will explain any common programming constructs used within.
Steps
-
1Know a few things about MATLAB.
- Semi-colon Operator: If a command is followed by a ';' then the output will not be printed on the screen. This is trivial when the output is a short assignment, like y = 1, but becomes problematic if a large matrix is created. Also, any time that an output is desired, like a graph, the semicolon should be omitted.
- Clear Command: There are a few useful command window commands. Typing “clear” in the command window after the >> prompt will clear all current variables, which can help if you're seeing unusual output. You can also type “clear” followed by a variable name to clear only the data for that specific variable.
- Variable Types: The only type of variable in MATLAB is an array. This means that variables are stored as lists of numbers, with the most basic list containing only one number. In the case of MATLAB, array size does not need to be specified when the variable is created. To set a variable to a single number, simply type something like z =1. If you then wanted to add on to z, you could simply state z[2] = 3. You can then reference the number stored at any position in the vector by typing z[i], where “i” is the Fifth position in the vector. So if you wanted to get the value 3 from the z example, you would simply type z[2].
- Loops: Loops are used when you want to perform an action multiple times. There are two types of loops common in MATLAB, the for loop and the while loop. Both can typically be used interchangeably, but it is easier to create an infinite while loop than an infinite for loop. You can tell if you have made an infinite loop by the fact that your computer will simply sit there, not outputting anything except what is inside the loop.
- For Loops: For loops in MATLAB take the form of: "for i = 1:n / do stuff / end" (the forward slash indicates a line break). This loop means “do stuff” n times. So if this printed “Hello” every time it went through the loop, and n was 5, then it would print “Hello” five times.
- While Loops: While loops in MATLAB take the form of: "while statement is true / do stuff / end". This loop means “do stuff” while the statement is true. Usually the “do stuff” portion has some part that will eventually make the statement false. To make a while loop look like the for loop above, you'd type "while i<=n / do stuff / end".
- Nested Loops: Nested loops are when a loop is inside of another loop. This looks something like "for i = 1:5 / for j = 1:5 / do stuff / end / end". This would do stuff 5 times for j, then increment i, do stuff 5 times for j, increment i, and so on.
- For more information on any part of this tutorial, or MATLAB in general, visit the MATLAB Documentation
-
2Open MATLAB. The window should look like this:Advertisement
-
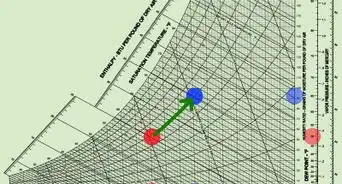
3Create a new Function file. You do not need to complete this step if you are simply plotting a basic function like y = sin(x). If this is the case, skip to step 4. To create a function file, simply select New from the File menu, then select Function from the drop down menu. You should get a window that looks like the following. This is the window where you will write your functions.
-
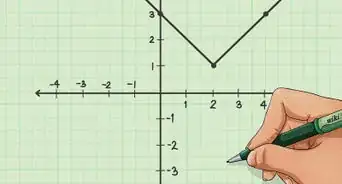
4Set up your Function file. Delete the [output args] portion and the "=" sign. These are only necessary if you want an output value, which isn't necessary for graphing. Change the "Untitled" part to whatever you want your function to be called. Insert a variable name instead of "input args." I will use "n" as the input argument from here onward. You'll use this variable to tell the program how many data points you want. Your code should look something like: You can either delete the parts after the % signs or leave them in, it's up to you, since anything following a '%' is considered to be a comment, and will be ignored by the computer when your function is executed.
-
5Set up your data. This step can be achieved in one of a few ways depending on what type of data you want to graph. If you want to plot a simple function like y = sin(x), use the simple method. If you have a set of data that is plotted against an increasing x value, such as (1, y1), (2, y2),...(n, yn) but want to use a variable number of points, then use the vector method. If you want to generate a list of points with 3 variables instead of 2, then the matrix method will be most useful.
- Simple Method: Decide on the range of x you want to use for your independent variables and by how much you want it to step each time. For example, ">>x = 0 : (pi/100) : (2*pi);" will set x to a list of values from 0 to 2*Pi with intervals of Pi/100. The middle part is optional and will default to intervals of 1 if it is left out (i.e. x = 1:10 will assign the numbers 1,2,3,...10 to x). Type your function on the command line in the command window. It will look something like ">> y = sin(x);"
-
Vector Method: Set up a for loop to place values into a vector. Vector assignments in MATLAB follow the form x(i) = 2, where “i” is any number greater than, but not including, zero. You can also reference parts of the vector that already have a value, like x(3) = x(2) + x(1). See the loops section of tips for help with loops. Keep in mind, n is the number you will use to determine the number of data points. Example:
-
Matrix Method: Set up two nested loops, meaning one loop within the other. The first loop should control your x values while the second loop should control your y values. Hitting tab before the second loop can help keep track of which loop is active at which point. Type your equation inside the second loop, which will be the values given to z. Matrix assignments follow the form x(i,j) = 4, where “i” and “j” are any two numbers greater than zero. Keep in mind, n is the number you will use to determine the number of data points. Example:
-
6Now set up your graph.
-
Simple and Vector Methods: Type plot(x) after your for loop if you used the vector method. If you used the simple method, type plot(x,y) and hit enter, then skip to step 8. The general form of the plot function is plot(x,y) where x and y are lists of numbers. Typing plot(z) will plot the values of z against a list of 1,2,3,4,5, etc.. You can choose the color of the points, the type of line used, and the shape of points used by adding a string following the arguments of plot. This would look something like plot(x,y,'r-p'). In this case, the 'r' would make the line red, the '-' would make a straight line between the points, and the 'p' will make the points appear as stars. The formatting must be enclosed with apostrophes.
- Matrix Method: Type mesh(x) after your nested for loops. Make sure you do not add a semi-colon after the mesh or plot statements.
-
Simple and Vector Methods: Type plot(x) after your for loop if you used the vector method. If you used the simple method, type plot(x,y) and hit enter, then skip to step 8. The general form of the plot function is plot(x,y) where x and y are lists of numbers. Typing plot(z) will plot the values of z against a list of 1,2,3,4,5, etc.. You can choose the color of the points, the type of line used, and the shape of points used by adding a string following the arguments of plot. This would look something like plot(x,y,'r-p'). In this case, the 'r' would make the line red, the '-' would make a straight line between the points, and the 'p' will make the points appear as stars. The formatting must be enclosed with apostrophes.
-
7Make sure the final line in your function file is "end" and save your file. Skip this step if you used the simple method. Examples of final code for the vector and matrix methods are below.
- Vector Method:
- Matrix Method:
-
8Execute the function. This is done by typing name(n) into the command window, where "name" is the name of your function and "n" is the number of points you want. Example: ">>FibGraph(8)".
-
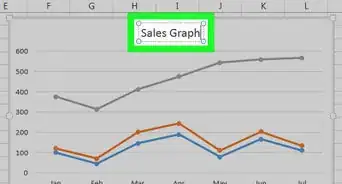
9View the results. A window should open with your graph.
- Vector Method:
- Matrix Method:


Advertisement
Things You'll Need
- Access to MATLAB
- Data to graph (optional)


About This Article
Advertisement