X
wikiHow is a “wiki,” similar to Wikipedia, which means that many of our articles are co-written by multiple authors. To create this article, 9 people, some anonymous, worked to edit and improve it over time.
This article has been viewed 115,676 times.
Learn more...
The sine and cosine functions appear all over math in trigonometry, pre-calculus, and even calculus. Understanding how to create and draw these functions is essential to these classes, and to nearly anyone working in a scientific field. This article will teach you how to graph the sine and cosine functions by hand, and how each variable in the standard equations transform the shape, size, and direction of the graphs.
Steps
Part 1
Part 1 of 3:
Graphing the Basic Equations
-
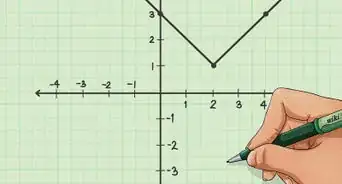
1Draw a coordinate plane.
- For a sine or cosine graph, simply go from 0 to 2π on the x-axis, and -1 to 1 on the y-axis, intersecting at the origin (0, 0).
- Both and repeat the same shape from negative infinity to positive infinity on the x-axis (you'll generally only graph a portion of it).
- Use the basic equations as given: and
-
2Graph the basic form of . Plot and connect the points (0, 0), (π/2, 1), (π, 0), and (3π/2, -1) with a continuous curve.
- Both and never go past -1 or 1 on the y-axis.
- Since you are only hand-drawing your graphs, there is no precise scale, but it must be accurate at certain points.
Advertisement -
3Graph the basic form of . Plot and connect the points (0, 1), (π/2, 0), (π, -1), and (3π/2, 0) with a continuous curve.
- It may be helpful to use two separate colors to distinguish between sine and cosine.


Advertisement
Part 2
Part 2 of 3:
Graphing Different Sine Equations
-
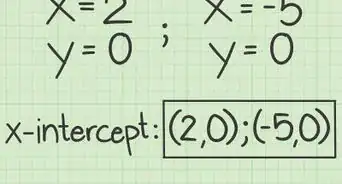
1Use the standard equation to define your variables.
- Find your values of A, B, C, and D.
- Note that in the basic equation for sine, A = 1, B = 1, C = 0, and D = 0.
-
2Calculate the period.
- Divide your period on the x-axis into four sections that are equal distances apart, just like in the basic equations. The y-values will still alternate from 0, 1, 0, and -1 just like in the basic equation.
-
3Calculate the amplitude.
- Multiply the y-values you have by A, and graph these new points.
- If A is negative, the graph will flip over the x-axis. This is called a reflection.
-
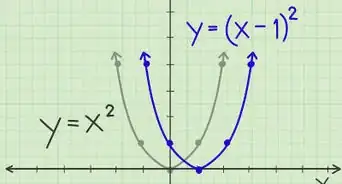
4Calculate the phase shift.
- This will move the graph to the left or right.
- For each x-value in the period, move the x-value to the left by C/B if C/B is negative, or move each x-value to the right by C/B if C/B is positive.
-
5Calculate the vertical shift.
- For each y-value, move the y-value up by D if D is positive, or move the y-value down if D is negative.
-
6Graph the final function. After each transformation has been applied, your graph is finished!


Advertisement
Part 3
Part 3 of 3:
Graphing Different Cosine Equations
-
1Use the standard equation to define your variables.
- Find your values of A, B, C, and D.
- Note that in the basic equation for cosine, A = 1, B = 1, C = 0, and D = 0.
-
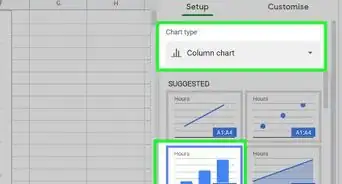
2Calculate the period.
- Divide your period on the x-axis into four sections that are equal distances apart, just like in the basic equations. The y-values will still alternate from 1, 0, -1, and 0 just like in the basic equation.
-
3Calculate the amplitude.
- Multiply the y-values you have by A, and graph these new points.
- If A is negative, the graph will flip over the x-axis. This is called a reflection.
-
4Calculate the phase shift.
- This will move the graph to the left or right.
- For each x-value in the period, move the x-value to the left by C/B if C/B is negative, or move each x-value to the right by C/B if C/B is positive.
-
5Calculate the vertical shift.
- This will move the graph up or down.
- For each y-value, move the y-value up by D if D is positive, or move the y-value down if D is negative.
-
6Graph the final function. After each transformation has been applied, your graph is finished!


Advertisement
Warnings
- Any negative values for a variable will essentially do the opposite of what a positive variable would do.⧼thumbs_response⧽
- It is important to calculate the amplitude and period first, because they will make it easier to apply the phase shift and vertical shift later on.⧼thumbs_response⧽
Advertisement
Things You'll Need
- Pencil or pen to draw
- Different colors to display the different shapes of the graph (optional)
- Graphing calculator or software to check your work (optional)


About This Article
Advertisement