This article was co-authored by wikiHow staff writer, Darlene Antonelli, MA. Darlene Antonelli is a Technology Writer and Editor for wikiHow. Darlene has experience teaching college courses, writing technology-related articles, and working hands-on in the technology field. She earned an MA in Writing from Rowan University in 2012 and wrote her thesis on online communities and the personalities curated in such communities.
This article has been viewed 38,203 times.
Learn more...
Windows' security system does so much more than just catching malware on the internet. It can also tell you when your computer isn't performing normally. However, if you would prefer a more detailed look into your computers' components and their performance, you can use Window's Performance Monitor, which is a built-in feature that's a little more detailed than what you get with Windows Security. This wikiHow will teach you how to use Windows Security as well as Performance Monitor to check your Windows 10 computer's performance.
Things You Should Know
- The "Device performance & health" area of Windows Security makes it easy to scan for hardware and software issues.
- Use the Performance Monitor to create custom monitoring graphs components like your processor, network card, RAM, GPU, and more.
- Press Ctrl + Alt + Del and select Task Manager to see how well your apps utilizing your hardware.
Steps
Using Windows Security
-
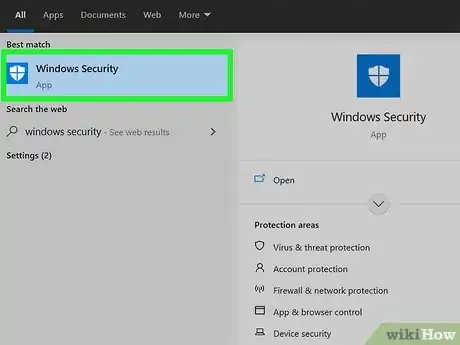
1Open "Windows Security." Press the Windows key to open your taskbar, then start typing to begin the search. Click the app from the search results to open it.
- Alternatively, you can open Settings and click Update & Security > Windows Security > Open Windows Security.
-
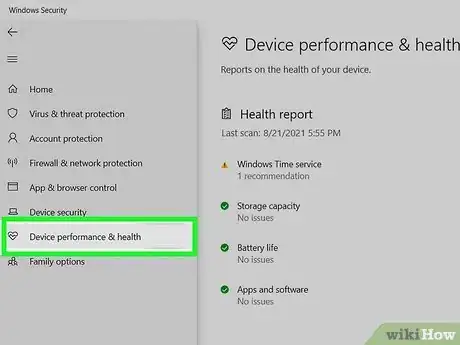
2Click Device performance & health. It's the tile with a heart icon.Advertisement
-
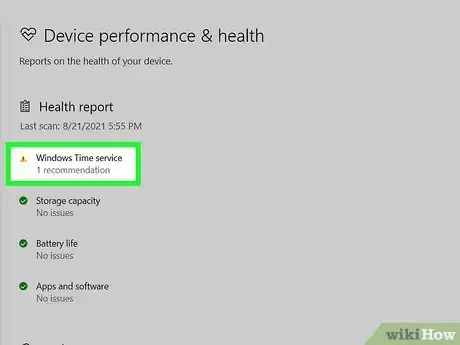
3Check the list for any yellow marks. While green marks are good, yellow marks indicate areas that need attention.
- If you see a yellow mark next to any of the listed items, click it to see what Windows 10 recommends you to do.
- If the date listed for the last scan date is not recent, you may want to run another scan to catch any issues or resolve them.[1]
- You can try navigating to this page again to attempt to trigger a quick scan for "Device performance health."
-
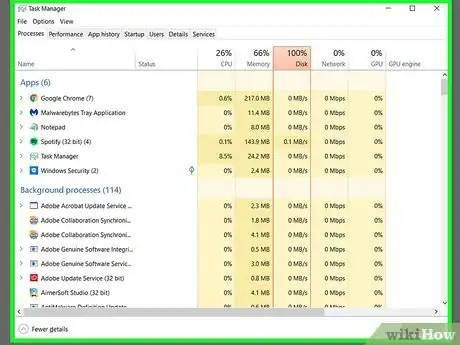
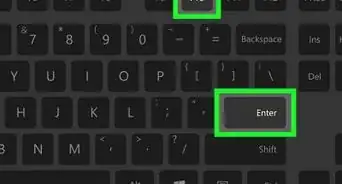
4Press Ctrl+⇧ Shift+Esc (to troubleshoot with task manager). This keyboard shortcut will open the task manager. Click the Performance tab to see your CPU, memory, or graphics card stats.
- If your CPU or graphics card consistently looks like it's pushed to 100% too often, you should close any unused applications that are running in the background. However, you may need to purchase an upgrade if closing those extra applications does not work.
- You can also check the memory usage on your computer. If that's too high as well, you can close extra applications and programs you have running in the background, or purchase an upgrade.
Using Performance Monitor
-
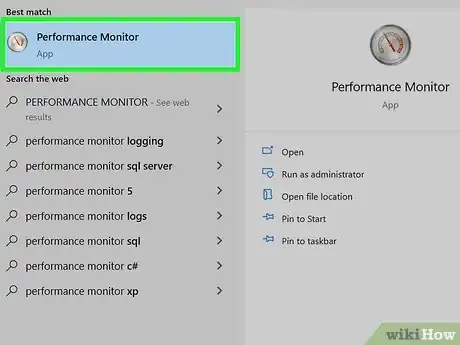
1Open Performance Monitor. To open it, you'll find the app in the Start menu, or you can press the Win key and type "Performance Monitor" inside the search bar that appears, then click the app that appears in the search results.
- If you are running Windows 10, this is not software that you need to download, but it is pre-installed with Windows 10 machines.
- You will immediately see real-time results of your computer's memory, network adapter, physical disk, and processor usage.
-
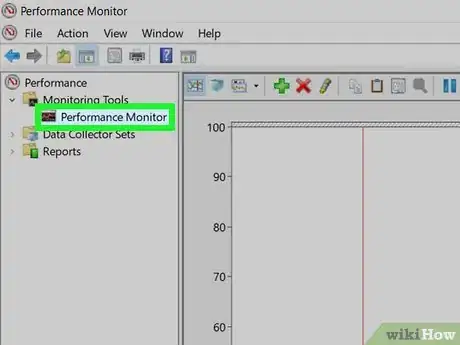
2Click Performance Monitor. It's in the panel on the left side of the window.
- You'll see a graph that represents your processor time or information, but you can add different elements to the monitor.
-
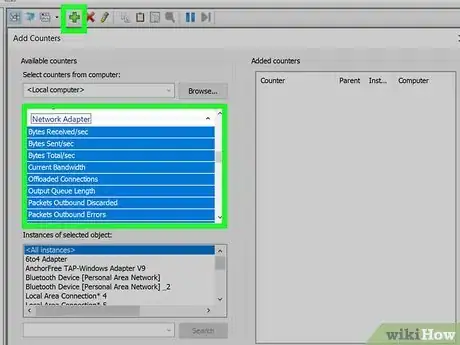
3Add new elements to monitor. Click the green +' icon at the top of the window so you can add more processes to the graph.
- Select your computer name or "Local computer" from the drop-down menu, then click the arrow beside a category to expand it. Finally, click a process to add it to the graph.
- For example, to add the "Bytes Received/sec" on the network adapter, click the green + icon, select "Local computer," click the arrow next to "Network Adapter" and click "Bytes Received/Sec." If you have more than one Network Adapter, you may have to specify which one you want to monitor.
- Finally, click OK to close the menu and add the process to the graph.
-
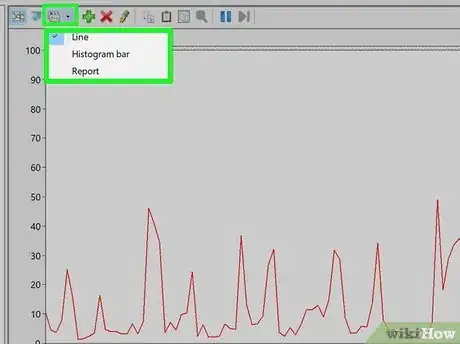
4Customize the Performance Monitor display. You can set different lines on the graph to varying colors so you can identify what line represents what process quicker.
- Double-click a line in the graph to open that line's "Performance Monitor Properties" window and navigate to the Data tab to edit the line appearances and colors.
- You can also change the overall graph by pressing Ctrl + G or clicking the "Change graph type" button in the toolbar to the left of the green + button.
- These graphs will give you indications that something might be wrong. For instance, if you notice that "Physical Disk" is displaying high numbers a lot, and that might indicate that it might be time to replace your physical disk.[2]
References
About This Article
1. Open "Windows Security".
2. Click Device performance & health.
3. Check the list for any yellow marks.
4. Press Ctrl + Shift + Esc (to troubleshoot with task manager).
-Step-17.webp)


-Step-17.webp)
