X
wikiHow is a “wiki,” similar to Wikipedia, which means that many of our articles are co-written by multiple authors. To create this article, volunteer authors worked to edit and improve it over time.
This article has been viewed 29,221 times.
Learn more...
The Bloomberg Terminal is a complex but extremely powerful tool for finding and manipulating data. It includes information pertaining to every publicly traded security as well as numerous other macro and microeconomic data sets. The Bloomberg Terminal is a computer preloaded with a software and specific hardware (double screens and a modified keyboard). You will need to have access to a Bloomberg Terminal complete with the specialized keyboard and a Bloomberg account.
Steps
Part 1
Part 1 of 2:
Loading a Security into the Bloomberg Module
-
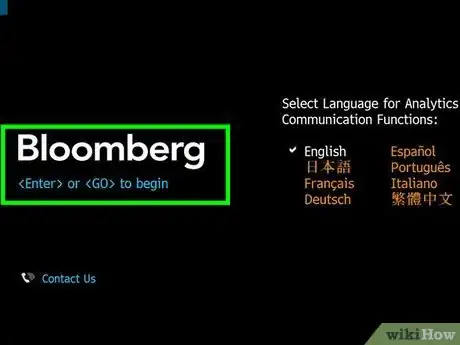
1Press the "Enter" key or "GO" button on your Bloomberg Terminal to access the log in screen and log in.
-
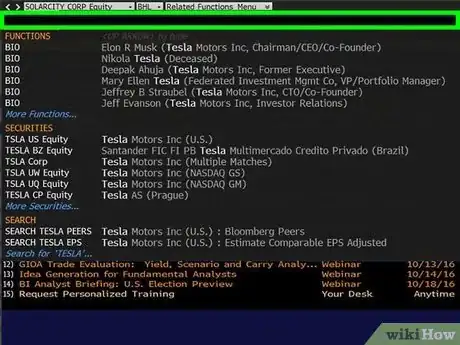
2Type the name or ticker of the publicly traded company in the search bar at the top of the screen.Advertisement
-
3Scroll down with the arrow keys on your keyboard until the company you selected is highlighter under "Securities". Then press on GO your keyboard.
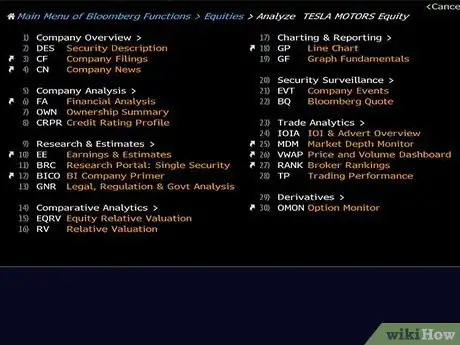
- This will bring up a menu screen with categories of available modules pertaining to this security.
- The security you selected is now loaded into that window on your Bloomberg Terminal, any modules you bring up now will have that security loaded into it until you specify otherwise.
Advertisement
Part 2
Part 2 of 2:
Using the Bloomberg Features
-
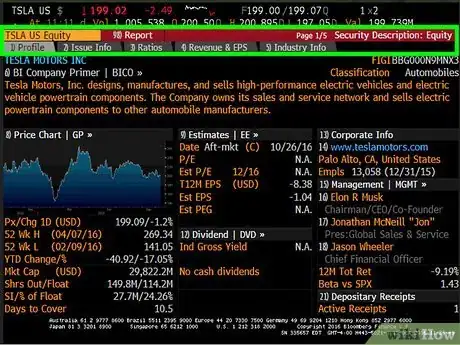
1Access the DES - Description Module. From the menu window, type "DES" and hit GO.
- This will bring up the description page for your security where you can quickly access key information such as market cap, trading statistics, analyst recommendations...
- From this screen you can go deeper by clicking on certain headings or simply by typing the number besides the headings in the search bar and pressing GO.
- To go back, hit the green menu key on your keyboard until you return to the DES home page or to the security menu.
-
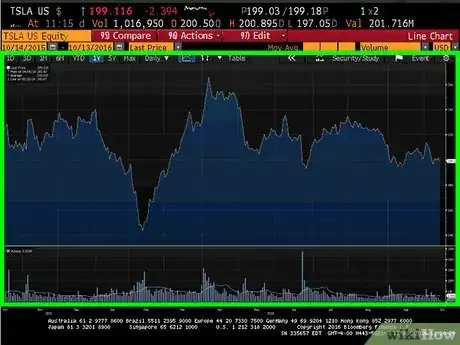
2Use the GP - Graph Module. To access the Graph Module, type GP into the search bar and hit GO.
- This will bring up a lined chart of the price of your security over a selected period of time.
- You can change the timeline at the top left of the graph from 1D one day to 1M one month to 1Y one year, or YTD for a Year To Date view.
-
3Look at HP - Historical Pricing. To access the Historical Pricing Module, type HP into the search bar and hit GO.
- This page allows you to see and more importantly extract historical trading data on your security into excel.
- Indicate your range data for the data to be extracted in the top left.
- Choose two data fields to extract in the drop down menus next to Market in the top left.
- Click on the red "Export to Excel" button or type 96 and GO into the search bar.
- Bloomberg will now launch Excel on your computer and load the data by itself.
-
4Consider the FA - Financial Analysis. To access the Financial Analysis Module, type FA into the search bar and hit GO.
- This module allows you to quickly access financial statements and metrics on your company.
- You can flip through the pages by clicking on the gray tabs at the top of the screen to access the income statements, balance sheet, and cash flow.
- For any metric, you can click on the bar graph icon to the left to visualize the data.
- You can add metrics by checking the boxes.
- When you are done, press the menu key on your keyboard to return to the Financial Analysis Module home page.
Advertisement
About This Article
Advertisement
