Excel 2000
Creating a Chart
The Chart Toolbar
Excel 2000 provides a number of ways to work with charts. The quickest way to create and edit your charts is to use the Chart Toolbar.
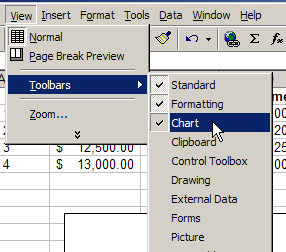
To show the Chart Toolbar:
- Choose View
 Toolbars
 Chart.

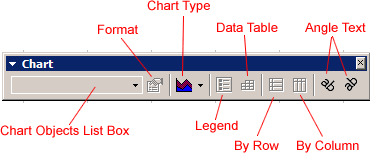
Parts of the Chart Toolbar:
<!!-- IMAGE | CLASSES -->
Chart Objects List Box
Allows you to select the individual parts of your chart.
Format Button
Allows you to format the current selection.
Chart Type
Use this to select the type of chart.
Legend
Show or hide the chart legend.
Data Table
Show or hide the actual data used to create the chart.
By Row
Displays the Y-axis using the row labels.
By Column
Displays the X-Axis using the column labels.
Angle Text
Use these to change the angle of the x and y axis labels.


