Statistics
Textbooks
Boundless Statistics
Visualizing Data
Statistics Textbooks Boundless Statistics Visualizing Data
Statistics Textbooks Boundless Statistics
Statistics Textbooks
Statistics

Section 2

Graphing Data

Book Version 1
By Boundless
Boundless Statistics
Statistics
by Boundless
View the full table of contents
7 concepts
Thumbnail
Statistical Graphics

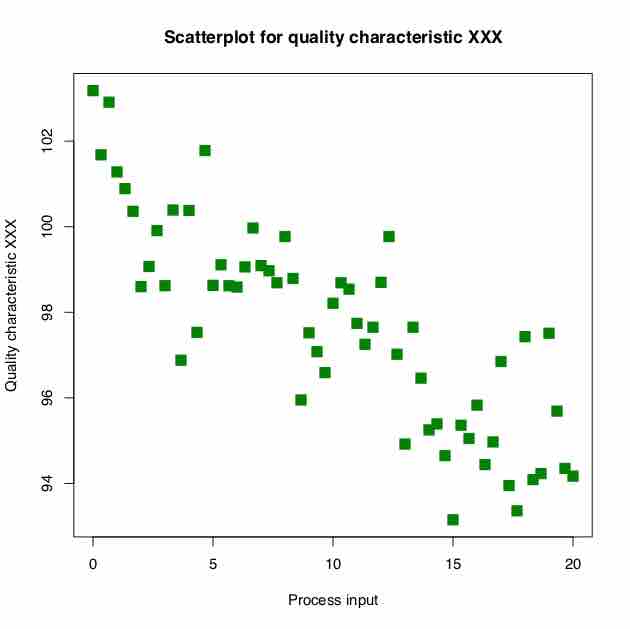
Statistical graphics allow results to be displayed in some sort of pictorial form and include scatter plots, histograms, and box plots.
Thumbnail
Stem-and-Leaf Displays

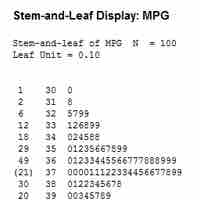
A stem-and-leaf display presents quantitative data in a graphical format to assist in visualizing the shape of a distribution.

Reading Points on a Graph

A graph is a representation of a set of objects where some pairs of the objects are connected by links.
Thumbnail
Plotting Points on a Graph

A plot is a graphical technique for representing a data set, usually as a graph showing the relationship between two or more variables.
Thumbnail
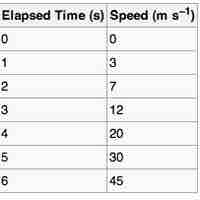
Slope and Intercept

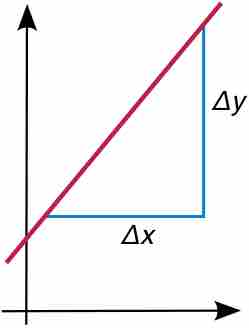
The concepts of slope and intercept are essential to understand in the context of graphing data.
Thumbnail
Plotting Lines

A line graph is a type of chart which displays information as a series of data points connected by straight line segments.
Thumbnail
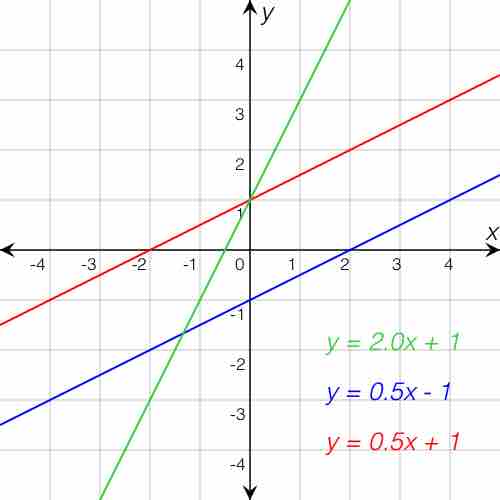
The Equation of a Line

In statistics, linear regression can be used to fit a predictive model to an observed data set of $y$ and $x$ values.

Subjects
  • Accounting
  • Algebra
  • Art History
  • Biology
  • Business
  • Calculus
  • Chemistry
  • Communications
  • Economics
  • Finance
  • Management
  • Marketing
  • Microbiology
  • Physics
  • Physiology
  • Political Science
  • Psychology
  • Sociology
  • Statistics
  • U.S. History
  • World History
  • Writing

Except where noted, content and user contributions on this site are licensed under CC BY-SA 4.0 with attribution required.