A plot is a graphical technique for representing a data set, usually as a graph showing the relationship between two or more variables. The plot can be drawn by hand or by a mechanical or electronic plotter. Graphs are a visual representation of the relationship between variables, very useful because they allow us to quickly derive an understanding which would not come from lists of values. Graphs can also be used to read off the value of an unknown variable plotted as a function of a known one. Graphs of functions are used in mathematics, sciences, engineering, technology, finance, and many other areas.
Plots play an important role in statistics and data analysis. The procedures here can be broadly split into two parts: quantitative and graphical. Quantitative techniques are the set of statistical procedures that yield numeric or tabular output. Examples of quantitative techniques include:
- hypothesis testing,
- analysis of variance (ANOVA),
- point estimates and confidence intervals, and
- least squares regression.
These and similar techniques are all valuable and are mainstream in terms of classical analysis. There are also many statistical tools generally referred to as graphical techniques. These include:
- scatter plots,
- histograms,
- probability plots,
- residual plots,
- box plots, and
- block plots.
Graphical procedures such as plots are a short path to gaining insight into a data set in terms of testing assumptions, model selection, model validation, estimator selection, relationship identification, factor effect determination, and outlier detection. Statistical graphics give insight into aspects of the underlying structure of the data.
Plotting Points
As an example of plotting points on a graph, consider one of the most important visual aids available to us in the context of statistics: the scatter plot.
To display values for "lung capacity" (first variable) and how long that person could hold his breath, a researcher would choose a group of people to study, then measure each one's lung capacity (first variable) and how long that person could hold his breath (second variable). The researcher would then plot the data in a scatter plot, assigning "lung capacity" to the horizontal axis, and "time holding breath" to the vertical axis.
A person with a lung capacity of 400 ml who held his breath for 21.7 seconds would be represented by a single dot on the scatter plot at the point
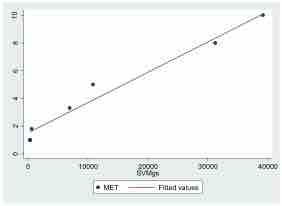
Scatterplot
Scatter plot with a fitted regression line.