Statistics
Textbooks
Boundless Statistics
Visualizing Data
Graphing Data
Statistics Textbooks Boundless Statistics Visualizing Data Graphing Data
Statistics Textbooks Boundless Statistics Visualizing Data
Statistics Textbooks Boundless Statistics
Statistics Textbooks
Statistics
Concept Version 7
Created by Boundless

The Equation of a Line

In statistics, linear regression can be used to fit a predictive model to an observed data set of $y$ and $x$ values.

Learning Objective

  • Examine simple linear regression in terms of slope and intercept


Key Points

    • Simple linear regression fits a straight line through a set of points that makes the vertical distances between the points of the data set and the fitted line as small as possible.
    • $y=mx+b$, where $m$ and $b$ designate constants is a common form of a linear equation.
    • Linear regression can be used to fit a predictive model to an observed data set of $y$ and $x$ values.

Term

  • linear regression

    an approach to modeling the relationship between a scalar dependent variable $y$ and one or more explanatory variables denoted $x$.


Full Text

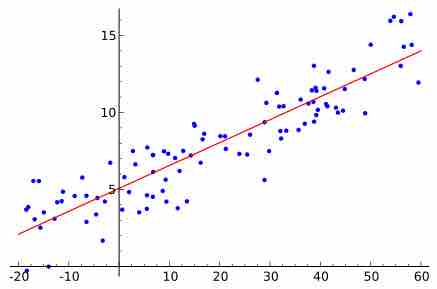
In statistics, simple linear regression is the least squares estimator of a linear regression model with a single explanatory variable. Simple linear regression fits a straight line through the set of $n$ points in such a way that makes the sum of squared residuals of the model (that is, vertical distances between the points of the data set and the fitted line) as small as possible.

The slope of the fitted line is equal to the correlation between $y$ and $x$ corrected by the ratio of standard deviations of these variables. The intercept of the fitted line is such that it passes through the center of mass $(x, y)$ of the data points.

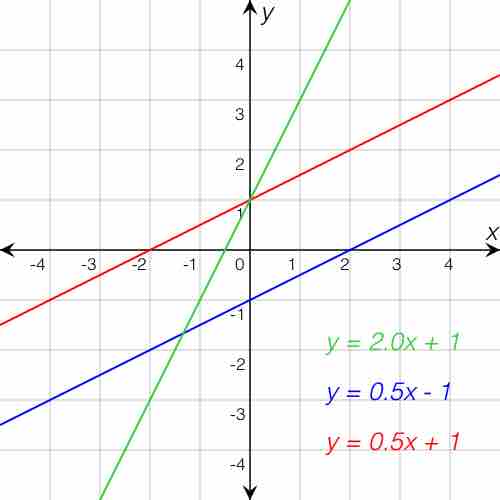
The function of a lne

Three lines — the red and blue lines have the same slope, while the red and green ones have same y-intercept.

Linear regression was the first type of regression analysis to be studied rigorously, and to be used extensively in practical applications. This is because models which depend linearly on their unknown parameters are easier to fit than models which are non-linearly related to their parameters and because the statistical properties of the resulting estimators are easier to determine.

A common form of a linear equation in the two variables $x$ and $y$ is:

$y=mx+b$

Where $m$ (slope) and $b$ (intercept) designate constants. The origin of the name "linear" comes from the fact that the set of solutions of such an equation forms a straight line in the plane. In this particular equation, the constant $m$ determines the slope or gradient of that line, and the constant term $b$ determines the point at which the line crosses the $y$-axis, otherwise known as the $y$-intercept.

If the goal is prediction, or forecasting, linear regression can be used to fit a predictive model to an observed data set of $y$ and $X$ values. After developing such a model, if an additional value of $X$ is then given without its accompanying value of $y$, the fitted model can be used to make a prediction of the value of $y$.

Linear regression

An example of a simple linear regression analysis

[ edit ]
Edit this content
Prev Concept
Plotting Lines
Guidelines for Plotting Frequency Distributions
Next Concept
Subjects
  • Accounting
  • Algebra
  • Art History
  • Biology
  • Business
  • Calculus
  • Chemistry
  • Communications
  • Economics
  • Finance
  • Management
  • Marketing
  • Microbiology
  • Physics
  • Physiology
  • Political Science
  • Psychology
  • Sociology
  • Statistics
  • U.S. History
  • World History
  • Writing

Except where noted, content and user contributions on this site are licensed under CC BY-SA 4.0 with attribution required.