wikiHow is a “wiki,” similar to Wikipedia, which means that many of our articles are co-written by multiple authors. To create this article, volunteer authors worked to edit and improve it over time.
This article has been viewed 122,588 times.
Learn more...
The two-sample t-test is one of the most common statistical tests used. It is applied to compare whether the averages of two data sets are significantly different, or if their difference is due to random chance alone. It could be used to determine if a new teaching method has really helped teach a group of kids better, or if that group is just more intelligent. Or, as in the example at the bottom, it could be used to determine if the new faster cars used for delivering pizzas really helped speed up delivery times!
Steps
-
1Determine a null and alternate hypothesis.
- In general, the null hypothesis will state that the two populations being tested have no statistically significant difference.[1]
- The alternate hypothesis will state that there is one present.
-
2Determine a confidence interval.[2]
- We will call this the alpha (α) level. The typical value is 0.05. This means that there is 95% confidence that the conclusion of this test will be valid.
Advertisement -
3Assign each population to one of two data sets.
- These values will need to be distinct when using the equation.
-
4Determine the n1 and n2 values.
- These are equal to the two sample sizes, or the number of data points in each population.
-
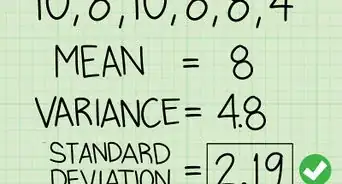
5Determine the degrees of freedom.[3]
- We will call this the k value. On the t-distribution table below, this value is referred to as df.
- To calculate this value, add both of the n values together and subtract 2.
-
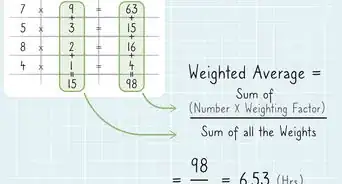
6Determine the means of the two sample sets.[4]
- We will call these x̄1 and x̄2.
- This is calculated by adding all of the data points in each sample set together, then dividing by the number of data points in the set (the corresponding n value).
-
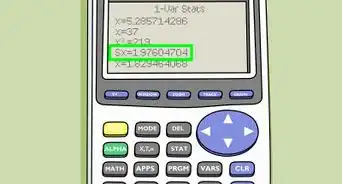
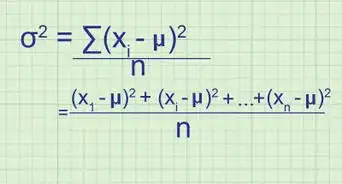
7Determine the variances of each data set.[5]
- We will call these the S-values.
- This is a number that describes how much the data varies inside its own sample set. Use the following formula.
-
8Compute the t-statistic using the following formula.
-
9Use the alpha and k values to find the critical t-value on the t-distribution table.
-
10Compare the critical t-value and the calculated t-statistic.[6]
- If the calculated t-statistic is greater than the critical t-value, the test concludes that there is a statistically significant difference between the two populations.
- Therefore, you reject the null hypothesis that there is no statistically significant difference between the two populations.
- In any other case, there is no statistically significant difference between the two populations.
- The test fails to reject the null hypothesis.
- If the calculated t-statistic is greater than the critical t-value, the test concludes that there is a statistically significant difference between the two populations.
-
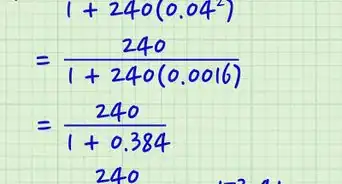
11Use the following example problem to practice the equations given above.


Community Q&A
-
QuestionIs this for Independent samples t-test or paired samples t-test?
 Community AnswerIndependent. Paired samples would have a "before" and "after" type of set-up where the sample sizes would be the same.
 -
QuestionWhat if x1-x2 (in step 8) gives a negative value? Mine is -1.5.
 Community AnswerThat means you'll have a negative t-statistic. If your alternate hypothesis is that the first population mean is less than the second population mean (or that the two population means are equal), your critical t value (what you compare the t-statistic to) is negative. You'll reject the null hypothesis if the t-statistic is less than (more negative) than the (negative) t-statistic.
 -
QuestionAre you rejecting the null or accepting since there is no significance?
 VenatrixxCommunity AnswerIf the two populations are not sufficiently different to produce a significant result, you will fail to reject the null hypothesis. The null hypothesis is never accepted; we can't prove that the populations are the same, so it remains a hypothesis. The two options are: 1. Reject the null hypothesis. (We do this when it's very unlikely that the differences are du to random chance alone.) 2. Fail to reject the null hypothesis. (There's not enough evidence that something other than random chance is causing the differences.)
Warnings
- Ensure that your data fits the requirements for the test before evaluation.⧼thumbs_response⧽
Things You'll Need
- Calculator
- 2 sets of data
- T-distribution table


References
- ↑ https://www.statisticshowto.datasciencecentral.com/probability-and-statistics/null-hypothesis/
- ↑ https://www.westga.edu/academics/research/vrc/assets/docs/TwoSampleProblems_LectureNotes.pdf
- ↑ https://www.westga.edu/academics/research/vrc/assets/docs/TwoSampleProblems_LectureNotes.pdf
- ↑ https://www.westga.edu/academics/research/vrc/assets/docs/TwoSampleProblems_LectureNotes.pdf
- ↑ https://www150.statcan.gc.ca/n1/edu/power-pouvoir/ch12/5214891-eng.htm
- ↑ https://libguides.library.kent.edu/spss/independentttest