This article was co-authored by Michael Simpson, PhD. Dr. Michael Simpson (Mike) is a Registered Professional Biologist in British Columbia, Canada. He has over 20 years of experience in ecology research and professional practice in Britain and North America, with an emphasis on plants and biological diversity. Mike also specializes in science communication and providing education and technical support for ecology projects. Mike received a BSc with honors in Ecology and an MA in Society, Science, and Nature from The University of Lancaster in England as well as a Ph.D. from the University of Alberta. He has worked in British, North American, and South American ecosystems, and with First Nations communities, non-profits, government, academia, and industry.
There are 10 references cited in this article, which can be found at the bottom of the page.
This article has been viewed 107,916 times.
Whether you’re conducting an experiment or learning algebra, understanding the relationship between independent and dependent variables is a valuable skill. Learning the difference between them can be tricky at first, but you’ll get the hang of it in no time.
Steps
Understanding Independent and Dependent Variables
-
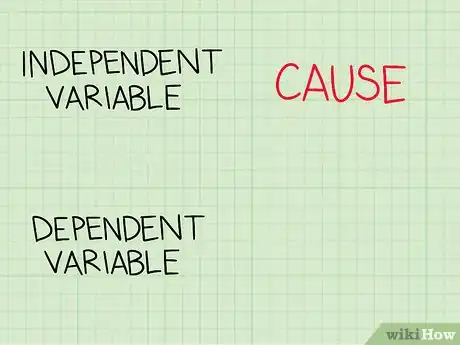
1Think of an independent variable as a cause that produces an effect. A variable is a category or characteristic that’s measured in an equation or experiment. An independent variable stands alone and isn’t affected by other variables. In a scientific experiment, a researcher changes an independent variable to see how it affects other variables.[1] [2]
- For example, if a researcher wants to see how well different doses of a medication work, the dose is the independent variable.
- Suppose you want to see if studying more improves your test scores. The amount of time you spend studying is the independent variable.
-
2Treat the dependent variable as an outcome. A dependent variable is an effect or result, and it always depends on another factor. The goal of an experiment or study is to explain or predict the dependent variables caused by the independent variable.[3] [4]
- Say a researcher is testing an allergy medication. Allergy relief after taking the dose is the dependent variable, or the outcome caused by taking the medicine.
Advertisement -
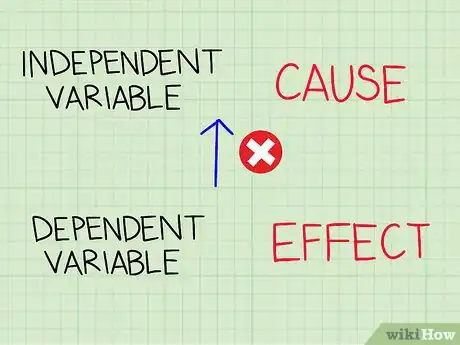
3Remember that a dependent variable can’t change an independent variable. When distinguishing between variables, ask yourself if it makes sense to say one leads to the other. Since a dependent variable is an outcome, it can’t cause or change the independent variable. For instance, “Studying longer leads to a higher test score” makes sense, but “A higher test score leads to studying longer” is nonsense.[5]
Tip: When you encounter variables, plug them into this sentence: “Independent variable causes Dependent Variable, but it isn't possible that Dependent Variable could cause Independent Variable.
For example: “A 5 mg dose of medication causes allergy relief, but it isn’t possible that allergy relief could cause a 5 mg dose of medication.”
Identifying Variables in Equations
-
1Use letters to represent variables in word problems. Turning statements with variables into math equations makes it easy to see which variable is which. For example, suppose your parents give you $3 for every chore you complete. You want to figure out how much you'll earn if you do a certain number of chores.[6]
- The $3 per chore is a constant. Your parents set that in stone, and that number isn't going to change. On the other hand, the number of chores you do and the total amount of money you earn aren't constant. They're variables that you want to measure.
- To set up an equation, use letters to represent the chores you do and the money you'll earn. Let t represent the total amount of money you earn and n stand for the number of chores you do.
-
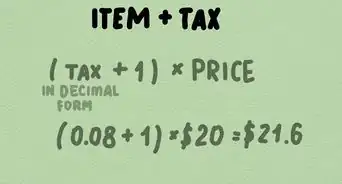
2Set up an equation with the variables. If you get $3 for every chore you complete, say out loud, “The total amount of money I'll earn (or t) equals $3 times the number of chores I do (or n).” That gives you the equation .[7]
- Notice that the amount of money you'll earn depends on the number of chores to do. Since it depends on other variables, it's the dependent variable.
-
3Practice solving equations to see how variables are connected. If, in the chores example, , and you do 5 chores, then . Doing 5 chores causes t to equal $15, so t depends on n.[8]
- Say an episode of your favorite TV show is 30 minutes. The total time in minutes (m) you'll spend watching TV equals 30 times the number of episodes (e) you watch. That gives you the equation . If you watch 3 episodes, .
-
4Plug different values into the independent variable. Remember that, in an experiment, a researcher changes the independent variable to see how it affects other variables.[9] Equations work the same way! Try solving your practice equations using different numbers for the independent variables.[10]
- Say you want to know how much you'll earn if you do 8 chores instead of 5. Plug 8 into n: . It's the same principle as a researcher changing the dose of a medication from 2 mg to 4 mg to test its effects.
Graphing Independent and Dependent Variables
-
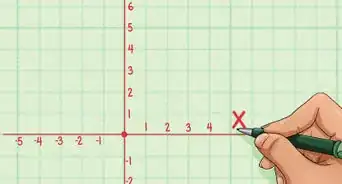
1Create a graph with x and y-axes. Draw a vertical line, which is the y-axis. Then make the x-axis, or a horizontal line that goes from the bottom of the y-axis to the right. The y-axis represents a dependent variable, while the x-axis represents an independent variable.[11]
- Say you sell apples and want to see how advertising affects your sales. The amount of money you spent in a month on advertising is the independent variable, or the factor that causes the effect you’re trying to understand. The number of apples you sold that month is the dependent variable.
-
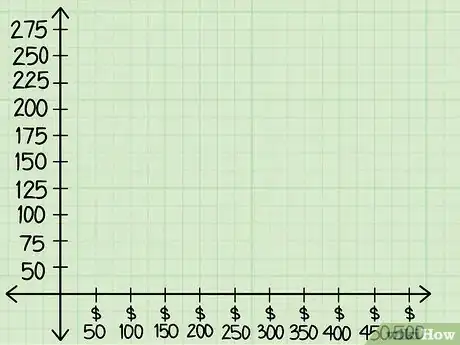
2Label the x-axis with units to measure your independent variable. Next, make dashes in even increments along the horizontal line. The line should now look a bit like a ruler. These dashes will stand for units, which you’ll use to measure your independent variables.[12]
- Suppose you’re trying to see if advertising more increases the number of apples you sold. Divide the x-axis into units to measure your monthly advertising budget.
- If you’ve spent between $0 and $500 a month in the last year on advertising, draw 10 dashes along the x-axis. Label the left end of the line “$0.” Then label each dash with a dollar amount in $50 increments ($50, $100, $150, and so on) until you’ve reached the last dash, or “$500.”
-
3Draw dashes along the y-axis to measure the dependent variable. As with the x-axis, make dashes along the y-axis to divide it into units. If you're studying the effects of advertising on your apple sales, the y-axis measures how many apples you sold per month.[13]
- Suppose your monthly apple sales have ranged between 60 and 250 over the last year. Draw 10 dashes across the y-axis, label the first “50,” and label the rest of the dashes in increments of 25 (50, 75, 100, and so on), until you’ve written 275 next to the last dash.
-
4Enter your variables' coordinates onto the graph. Use your variables’ number values as coordinates, and place a dot on the corresponding point on your graph. The coordinate is where invisible lines running from the x and y-axes cross each other.[14]
- For instance, if you spent $350 on advertising last month, find the dash labeled “350” on the x-axis. If last month’s apple sales totaled 225, find the dash labeled “225” on the y-axis. Draw a dot at the point at the graph coordinate ($350, 225), then continue graphing points for the rest of your monthly numbers.
-
5Look for patterns in the points you’ve graphed. If the dots form a recognizable pattern, such as a roughly organized line, there’s a relationship between the independent and dependent variables. The independent variable probably doesn’t affect the dependent variable if the dots are randomly scattered across the graph without any recognizable order.[15]
- For example, say you’ve graphed your advertising expenses and monthly apple sales, and the dots are arranged in an upward sloped line. This means that your monthly sales were higher when you spent more on advertising.
Expert Q&A
-
QuestionWhat are dependent and independent variables in a study?
 Michael Simpson, PhDDr. Michael Simpson (Mike) is a Registered Professional Biologist in British Columbia, Canada. He has over 20 years of experience in ecology research and professional practice in Britain and North America, with an emphasis on plants and biological diversity. Mike also specializes in science communication and providing education and technical support for ecology projects. Mike received a BSc with honors in Ecology and an MA in Society, Science, and Nature from The University of Lancaster in England as well as a Ph.D. from the University of Alberta. He has worked in British, North American, and South American ecosystems, and with First Nations communities, non-profits, government, academia, and industry.
Scientific Researcher In a study design, the dependent variables are the responses that you measure on, in or around the subjects you are studying. The results you get will be based on the independent variable.
 -
QuestionWhat is the main difference between dependent and independent variables?
 Michael Simpson, PhDDr. Michael Simpson (Mike) is a Registered Professional Biologist in British Columbia, Canada. He has over 20 years of experience in ecology research and professional practice in Britain and North America, with an emphasis on plants and biological diversity. Mike also specializes in science communication and providing education and technical support for ecology projects. Mike received a BSc with honors in Ecology and an MA in Society, Science, and Nature from The University of Lancaster in England as well as a Ph.D. from the University of Alberta. He has worked in British, North American, and South American ecosystems, and with First Nations communities, non-profits, government, academia, and industry.
Scientific Researcher The difference between independent and dependent variables is essentially the difference between cause and effect. For example, if you are studying the growth of a plant species under different fertilizer concentrations, you might choose height as your variable if your hypothesis is that fertilizer concentration affects plant height. Height is your dependent variable because, according to your hypothesis, it is dependent on fertilizer concentration.
 -
QuestionWhat is the independent and dependent variable for y+5 = x^2 / 3+1?
 DonaganTop AnswererThe variable that is expressed in the first degree (having an exponent of 1) is the dependent variable. In this case, it's y.
References
- ↑ Michael Simpson, PhD. Registered Professional Biologist. Expert Interview. 25 June 2021.
- ↑ https://researchbasics.education.uconn.edu/variables/
- ↑ Michael Simpson, PhD. Registered Professional Biologist. Expert Interview. 25 June 2021.
- ↑ https://libguides.usc.edu/writingguide/variables
- ↑ https://nces.ed.gov/nceskids/help/user_guide/graph/variables.asp
- ↑ https://www.khanacademy.org/math/algebra/introduction-to-algebra/alg1-dependent-independent/e/dependent-and-independent-variables
- ↑ https://www.khanacademy.org/math/algebra/introduction-to-algebra/alg1-dependent-independent/e/dependent-and-independent-variables
- ↑ https://www.mathsisfun.com/algebra/equations-solving.html
- ↑ Michael Simpson, PhD. Registered Professional Biologist. Expert Interview. 25 June 2021.
- ↑ https://www.khanacademy.org/math/pre-algebra/pre-algebra-equations-expressions/pre-algebra-dependent-independent/a/dependent-and-independent-variables-review
- ↑ https://www2.nau.edu/lrm22/lessons/graph_tips/graph_tips.html
- ↑ https://www2.nau.edu/lrm22/lessons/graph_tips/graph_tips.html
- ↑ https://www2.nau.edu/lrm22/lessons/graph_tips/graph_tips.html
- ↑ https://www.khanacademy.org/math/cc-sixth-grade-math/cc-6th-equations-and-inequalities/cc-6th-dependent-independent/v/dependent-and-independent-variables-exercise-example-2
- ↑ https://nces.ed.gov/nceskids/help/user_guide/graph/line.asp
