Statistics
Textbooks
Boundless Statistics
Other Hypothesis Tests
The Chi-Squared Test
Statistics Textbooks Boundless Statistics Other Hypothesis Tests The Chi-Squared Test
Statistics Textbooks Boundless Statistics Other Hypothesis Tests
Statistics Textbooks Boundless Statistics
Statistics Textbooks
Statistics
Concept Version 10
Created by Boundless

Goodness of Fit

The goodness of fit test determines whether the data "fit" a particular distribution or not.

Learning Objective

  • Outline the procedure for the goodness of fit test


Key Points

    • The test statistic for a goodness-of-fit test is: $\chi ^{2}=\sum_{i=1}^{k}\frac{(O-E)^{2}}{E}$, where $O$ is the observed values (data), $E$ is the expected values (from theory), and $k$ is the number of different data cells or categories.
    • The goodness-of-fit test is almost always right tailed. If the observed values and the corresponding expected values are not close to each other, then the test statistic can get very large and will be way out in the right tail of the chi-square curve.
    • If the observed values and the corresponding expected values are not close to each other, then the test statistic can get very large and will be way out in the right tail of the chi-square curve.
    • The null hypothesis for a chi-square test is that the observed values are close to the predicted values.
    • The alternative hypothesis is that they are not close to the predicted values.

Terms

  • binomial distribution

    the discrete probability distribution of the number of successes in a sequence of n independent yes/no experiments, each of which yields success with probability $p$

  • goodness of fit

    how well a statistical model fits a set of observations


Full Text

Procedure for the Goodness of Fit Test

Goodness of fit means how well a statistical model fits a set of observations. A measure of goodness of fit typically summarize the discrepancy between observed values and the values expected under the model in question. Such measures can be used in statistical hypothesis testing, e.g., to test for normality of residuals or to test whether two samples are drawn from identical distributions.

In this type of hypothesis test, we determine whether the data "fit" a particular distribution or not. For example, we may suspect that our unknown data fits a binomial distribution. We use a chi-square test (meaning the distribution for the hypothesis test is chi-square) to determine if there is a fit or not. The null and the alternate hypotheses for this test may be written in sentences or may be stated as equations or inequalities.

The test statistic for a goodness-of-fit test is: 

$\displaystyle{\chi ^{2}=\sum_{i=1}^{k}\dfrac{(O-E)^{2}}{E}}$

where $O$ is the observed values (data), $E$ is the expected values (from theory), and $k$ is the number of different data cells or categories.

The observed values are the data values and the expected values are the values we would expect to get if the null hypothesis was true. The degrees of freedom are found as follows:

$df = n-1$ 

where $n$ is the number of categories.The goodness-of-fit test is almost always right tailed. If the observed values and the corresponding expected values are not close to each other, then the test statistic can get very large and will be way out in the right tail of the chi-square curve.

As an example, suppose a coin is tossed 100 times. The outcomes would be expected to be 50 heads and 50 tails. If 47 heads and 53 tails are observed instead, does this deviation occur because the coin is biased, or is it by chance?

The null hypothesis for the above experiment is that the observed values are close to the predicted values. The alternative hypothesis is that they are not close to the predicted values. These hypotheses hold for all chi-square goodness of fit tests. Thus in this case the null and alternative hypotheses corresponds to:

Null hypothesis: The coin is fair.

Alternative hypothesis: The coin is biased.

We calculate chi-square by substituting values for $O$ and $E$.

For heads: 

$\dfrac{(47-50)^2}{50}=.18$

For tails: 

$\dfrac{(53-50)^2}{50}=.18$

The sum of these categories is:

$0.18 + 0.18 = 0.36$

Significance of the chi-square test for goodness of fit value is established by calculating the degree of freedom $\nu$ (the Greek letter nu) and by using the chi-square distribution table. The $\nu$ in a chi-square goodness of fit test is equal to the number of categories, $c$, minus one ($\nu=c-1$). This is done in order to check if the null hypothesis is valid or not, by looking at the critical chi-square value from the table that corresponds to the calculated $\nu$. If the calculated chi-square is greater than the value in the table, then the null hypothesis is rejected, and it is concluded that the predictions made were incorrect. In the above experiment, $\nu = 2-1 = 1$. The critical value for a chi-square for this example at $a = 0.05$ and $\nu=1$ is $3.84$, which is greater than $\chi ^ 2 = 0.36$. Therefore the null hypothesis is not rejected, and the coin toss was fair.

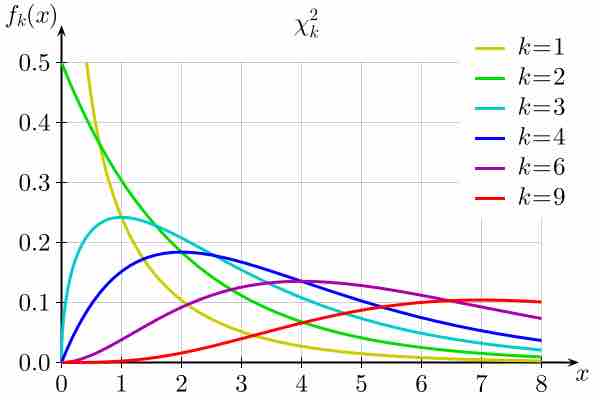
Chi-Square Distribution

Plot of the chi-square distribution for values of $k = \{ 1,2,3,4,6,9\}$.

[ edit ]
Edit this content
Prev Concept
How Fisher Used the Chi-Squared Test
Inferences of Correlation and Regression
Next Concept
Subjects
  • Accounting
  • Algebra
  • Art History
  • Biology
  • Business
  • Calculus
  • Chemistry
  • Communications
  • Economics
  • Finance
  • Management
  • Marketing
  • Microbiology
  • Physics
  • Physiology
  • Political Science
  • Psychology
  • Sociology
  • Statistics
  • U.S. History
  • World History
  • Writing

Except where noted, content and user contributions on this site are licensed under CC BY-SA 4.0 with attribution required.