The chi-square test of association allows us to evaluate associations (or correlations) between categorical data. It indicates whether there is an association between two categorical variables, but unlike the correlation coefficient between two quantitative variables, it does not in itself give an indication of the strength of the association.
nIn order to describe the association more fully, it is necessary to identify the cells that have large differences between the observed and expected frequencies. These differences are referred to as residuals, and they can be standardized and adjusted to follow a normal distribution with mean
where
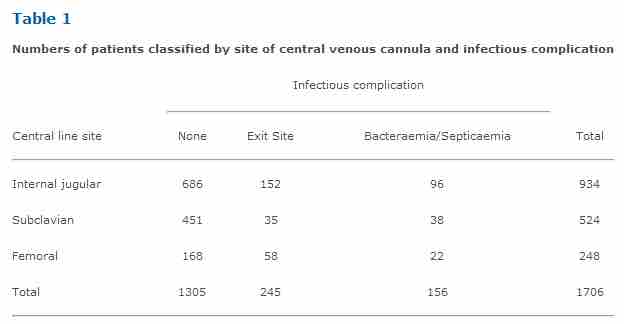
Table 1
Numbers of patients classified by site of central venous cannula and infectious complication. This table shows the proportions of patients in the sample with cannulae sited at the internal jugular, subclavian and femoral veins. Using the above formula to find the adjusted standardized residual for those with cannulae sited at the internal jugular and no infectious complications yields:
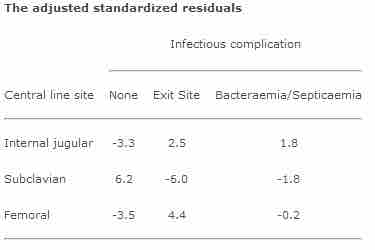
Table 2
The adjusted standardized residuals from Table 1.