When comparing two population proportions, we start with two assumptions:
- The two independent samples are simple random samples that are independent.
- The number of successes is at least five and the number of failures is at least five for each of the samples.
Comparing two proportions (e.g., comparing two means) is common. If two estimated proportions are different, it may be due to a difference in the populations or it may be due to chance. A hypothesis test can help determine if a difference in the estimated proportions:
reflects a difference in the population proportions.
The difference of two proportions follows an approximate normal distribution. Generally, the null hypothesis states that the two proportions are the same. That is,
The pooled proportion is calculated as follows:
The distribution for the differences is:
The test statistic (
Example
Two types of medication for hives are being tested to determine if there is a difference in the proportions of adult patient reactions. 20 out of a random sample of 200 adults given medication
Let
Random Variable:
is the difference in the proportions of adult patients who did not react after 30 minutes to medication
The words "is a difference" tell you the test is two-tailed.
Distribution for the test: Since this is a test of two binomial population proportions, the distribution is normal:
Therefore:
Calculate the
Estimated proportion for group
Estimated proportion for group
Graph:
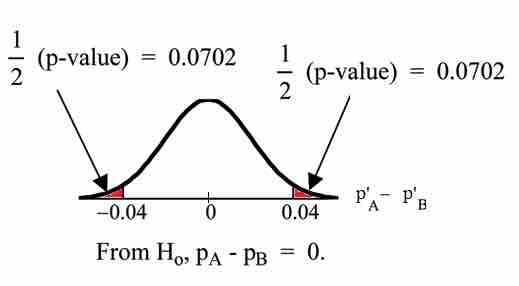
$p$ -Value Graph
This image shows the graph of the
Half the
Compare
Make a decision: Since
Conclusion: At a 1% level of significance, from the sample data, there is not sufficient evidence to conclude that there is a difference in the proportions of adult patients who did not react after 30 minutes to medication