Statistics
Textbooks
Boundless Statistics
Estimation and Hypothesis Testing
Confidence Intervals
Statistics Textbooks Boundless Statistics Estimation and Hypothesis Testing Confidence Intervals
Statistics Textbooks Boundless Statistics Estimation and Hypothesis Testing
Statistics Textbooks Boundless Statistics
Statistics Textbooks
Statistics
Concept Version 10
Created by Boundless

Confidence Interval for a Population Mean, Standard Deviation Known

In this section, we outline an example of finding the confidence interval for a population mean when we know the standard deviation.

Learning Objective

  • Calculate the confidence interval for a mean given that standard deviation is known


Key Points

    • Our example is for scores on exams in statistics that are normally distributed with an unknown population mean and a population standard deviation of 3 points.
    • A random sample of 36 scores is taken and gives a sample mean (sample mean score) of 68.
    • The 90% confidence interval for the mean score is $(67.1775, 68.8225)$.
    • We are 90% confident that the interval from 67.1775% to 68.8225% contains the true mean score of all the statistics exams: 90% of all confidence intervals constructed in this way contain the true mean statistics exam score.

Terms

  • confidence interval

    A type of interval estimate of a population parameter used to indicate the reliability of an estimate.

  • margin of error

    An expression of the lack of precision in the results obtained from a sample.


Full Text

Step By Step Example of a Confidence Interval for a Mean—Standard Deviation Known

Suppose scores on exams in statistics are normally distributed with an unknown population mean, and a population standard deviation of 3 points. A random sample of 36 scores is taken and gives a sample mean (sample mean score) of 68. To find a 90% confidence interval for the true (population) mean of statistics exam scores, we have the following guidelines:

  1. Plan: State what we need to know.
  2. Model: Think about the assumptions and check the conditions.
  3. State the parameters and the sampling model.
  4. Mechanics: $\text{CL} = 0.90$, so $\alpha = 1-\text{CL} = 1-0.90 = 0.10$; $\alpha_{0.05}$ is $1-0.05 = 0.95$; So $z_{0.05} = 1.645$
  5. Conclusion: Interpret your result in the proper context, and relate it to the original question.

1. In our example, we are asked to find a 90% confidence interval for the mean exam score, $\mu$, of statistics students.

We have a sample of 68 students.

2. We know the population standard deviation is 3. We have the following conditions:

  • Randomization Condition: The sample is a random sample.
  • Independence Assumption: It is reasonable to think that the exam scores of 36 randomly selected students are independent.
  • 10% Condition: We assume the statistic student population is over 360 students, so 36 students is less than 10% of the population.
  • Sample Size Condition: Since the distribution of the stress levels is normal, our sample of 36 students is large enough.

3. The conditions are satisfied and $\sigma$ is known, so we will use a confidence interval for a mean with known standard deviation. We need the sample mean and margin of error (ME):

$\bar { x } =68 \\ \sigma =3 \\ n=36 \\ \text{ME}={ z }_{ \frac { \alpha }{ 2 } }\left( \dfrac { \sigma }{ \sqrt { n } } \right)$

4. below shows the steps for calculating the confidence interval.

$\displaystyle {\text{ME} = 1.645\cdot \frac{3}{\sqrt{36}} = 0.8225 \\ \bar{x} - \text{ME} = 68-0.8225 = 67.1775 \\ \bar{x} + \text{ME} = 68+0.8225 = 68.8225}$

The 90% confidence interval for the mean score is $(67.1775, 68.8225)$.

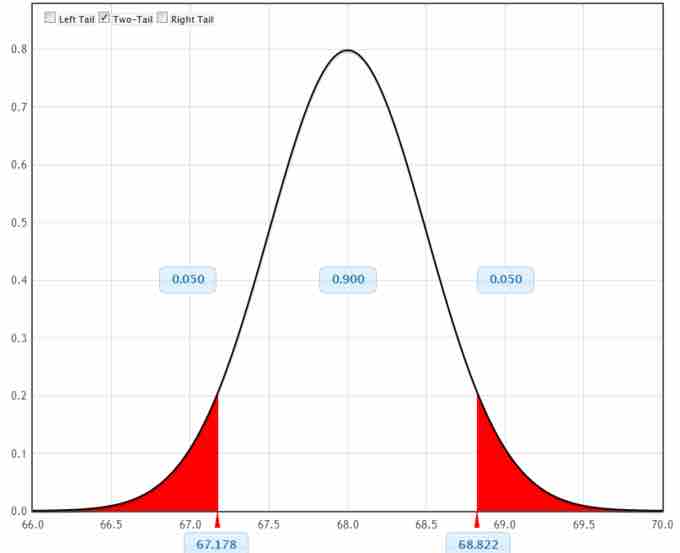
Graphical Representation

This figure is a graphical representation of the confidence interval we calculated in this example.

5. In conclusion, we are 90% confident that the interval from 67.1775 to 68.8225 contains the true mean score of all the statistics exams. 90% of all confidence intervals constructed in this way contain the true mean statistics exam score.

[ edit ]
Edit this content
Prev Concept
Confidence Interval for a Population Proportion
Confidence Interval for a Population Mean, Standard Deviation Not Known
Next Concept
Subjects
  • Accounting
  • Algebra
  • Art History
  • Biology
  • Business
  • Calculus
  • Chemistry
  • Communications
  • Economics
  • Finance
  • Management
  • Marketing
  • Microbiology
  • Physics
  • Physiology
  • Political Science
  • Psychology
  • Sociology
  • Statistics
  • U.S. History
  • World History
  • Writing

Except where noted, content and user contributions on this site are licensed under CC BY-SA 4.0 with attribution required.