Statistics
Textbooks
Boundless Statistics
Estimation and Hypothesis Testing
Confidence Intervals
Statistics Textbooks Boundless Statistics Estimation and Hypothesis Testing Confidence Intervals
Statistics Textbooks Boundless Statistics Estimation and Hypothesis Testing
Statistics Textbooks Boundless Statistics
Statistics Textbooks
Statistics
Concept Version 9
Created by Boundless

Confidence Interval for a Population Proportion

The procedure to find the confidence interval and the confidence level for a proportion is similar to that for the population mean.

Learning Objective

  • Calculate the confidence interval given the estimated proportion of successes


Key Points

    • Confidence intervals can be calculated for the true proportion of stocks that go up or down each week and for the true proportion of households in the United States that own personal computers.
    • To form a proportion, take XXX (the random variable for the number of successes) and divide it by nnn (the number of trials, or the sample size).
    • If we divide the random variable by nnn, the mean by nnn, and the standard deviation by nnn, we get a normal distribution of proportions with P′P'P​′​​, called the estimated proportion, as the random variable.
    • This formula is similar to the error bound formula for a mean, except that the "appropriate standard deviation" is different.

Term

  • error bound

    The margin or error that depends on the confidence level, sample size, and the estimated (from the sample) proportion of successes.


Example

    • Suppose that a market research firm is hired to estimate the percent of adults living in a large city who have cell phones. 500 randomly selected adult residents in this city are surveyed to determine whether they have cell phones. Of the 500 people surveyed, 421 responded yes, they own cell phones. Using a 95% confidence level, compute a confidence interval estimate for the true proportion of adults residents of this city who have cell phones.

Full Text

During an election year, we often read news articles that state confidence intervals in terms of proportions or percentages. For example, a poll for a particular presidential candidate might show that the candidate has 40% of the vote, within 3 percentage points. Often, election polls are calculated with 95% confidence. This mean that pollsters are 95% confident that the true proportion of voters who favor the candidate lies between 0.37 and 0.43:

(0.40−0.03,0.40+0.03)(0.40-0.03, 0.40+0.03)(0.40−0.03,0.40+0.03)

Investors in the stock market are interested in the true proportion of stock values that go up and down each week. Businesses that sell personal computers are interested in the proportion of households (say, in the United States) that own personal computers. Confidence intervals can be calculated for both scenarios.

Although the procedure to find the confidence interval, sample size, error bound, and confidence level for a proportion is similar to that for the population mean, the formulas are different.

Proportion Problems

How do you know if you are dealing with a proportion problem? First, the underlying distribution is binomial (i.e., there is no mention of a mean or average). If XXX is a binomial random variable, then X∼B(n,p)X\sim B(n,p)X∼B(n,p) where nnn is the number of trials and ppp is the probability of a success. To form a proportion, take XXX (the random variable for the number of successes) and divide it by nnn (the number of trials or the sample size). The random variable P′P'P​′​​ (read "PPP prime") is that proportion:

P′=Xn\displaystyle { P }^{ ' }=\frac { X }{ n }P​​′​​​​=​n​​X​​

Sometimes the random variable is denoted as P^\hat{P}​P​^​​ (read as PPP hat)

When nnn is large and ppp is not close to 0 or 1, we can use the normal distribution to approximate the binomial.

X∼N(n⋅p,n⋅p⋅q)X\sim N\left( n\cdot p,\sqrt { n\cdot p\cdot q } \right)X∼N(n⋅p,√​n⋅p⋅q​​​)

If we divide the random variable by nnn, the mean by nnn, and the standard deviation by nnn, we get a normal distribution of proportions with P′P'P​′​​, called the estimated proportion, as the random variable. (Recall that a proportion is the number of successes divided by nnn.)

Xn=P′∼N(n−pn,n⋅p⋅qn)\displaystyle \frac { X }{ n } ={ P }^{ ' }\sim N\left( \frac { n-p }{ n } ,\frac { \sqrt { n\cdot p\cdot q } }{ n } \right)​n​​X​​=P​​′​​​​∼N(​n​​n−p​​,​n​​√​n⋅p⋅q​​​​​)

Using algebra to simplify:

n⋅p⋅qn=p⋅qn\displaystyle \frac { \sqrt { n\cdot p\cdot q } }{ n } =\sqrt { \frac { p\cdot q }{ n } }​n​​√​n⋅p⋅q​​​​​=√​​n​​p⋅q​​​​​

P′P'P​′​​ follows a normal distribution for proportions:

P′∼N(p,p⋅qn){ P }^{ ' }\sim N\left( p,\sqrt { \frac { p\cdot q }{ n } } \right)P​​′​​​​∼N(p,√​​n​​p⋅q​​​​​)

The confidence interval has the form (p′−EBP,p′+EBP)(p'-\text{EBP}, p'+\text{EBP})(p​′​​−EBP,p​′​​+EBP).

  • p′=xn\displaystyle{{ p }^{ ' }=\frac { x }{ n }}p​​′​​​​=​n​​x​​
  • p′p'p​′​​ is the estimated proportion of successes (p′p'p​′​​ is a point estimate for ppp, the true proportion)
  • xxx is the number of successes
  • nnn is the size of the sample

The error bound for a proportion is seen in the formula in:

EBP=zα2p′q′n\displaystyle \text{EBP} = z_{\frac{\alpha}{2}}\sqrt{\frac{p'q'}{n}}EBP=z​​2​​α​​​​√​​n​​p​′​​q​′​​​​​​​

where q′=1−p′q'=1-p'q​′​​=1−p​′​​.

This formula is similar to the error bound formula for a mean, except that the "appropriate standard deviation" is different. For a mean, when the population standard deviation is known, the appropriate standard deviation that we use is σn\frac { \sigma }{ \sqrt { n } }​√​n​​​​​σ​​. For a proportion, the appropriate standard deviation is p⋅qn\sqrt { \frac { p\cdot q }{ n } }√​​n​​p⋅q​​​​​.

However, in the error bound formula, we use p′⋅q′n\sqrt { \frac { { p }^{ ' }\cdot { q }^{ ' } }{ n } }√​​n​​p​​′​​​​⋅q​​′​​​​​​​​​ as the standard deviation, instead of p⋅qn\sqrt { \frac { p\cdot q }{ n } }√​​n​​p⋅q​​​​​.

In the error bound formula, the sample proportions p′p'p​′​​ and q′q'q​′​​ are estimates of the unknown population proportions ppp and qqq. The estimated proportions p′p'p​′​​ and q′q'q​′​​ are used because ppp and qqq are not known. p′p'p​′​​ and q′q'q​′​​ are calculated from the data. p′p'p​′​​ is the estimated proportion of successes. q′q'q​′​​ is the estimated proportion of failures.

The confidence interval can only be used if the number of successes
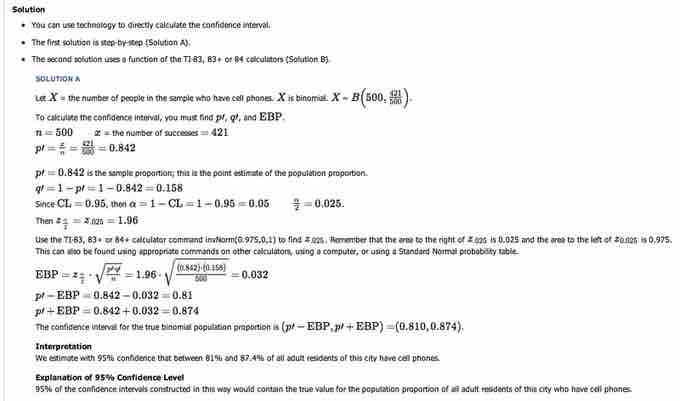
 np′np'np​′​​ and the number of failures nq′nq'nq​′​​ are both larger than 5.

Solution

This image shows the solution to our example.

[ edit ]
Edit this content
Prev Concept
Determining Sample Size
Confidence Interval for a Population Mean, Standard Deviation Known
Next Concept
Subjects
  • Accounting
  • Algebra
  • Art History
  • Biology
  • Business
  • Calculus
  • Chemistry
  • Communications
  • Economics
  • Finance
  • Management
  • Marketing
  • Microbiology
  • Physics
  • Physiology
  • Political Science
  • Psychology
  • Sociology
  • Statistics
  • U.S. History
  • World History
  • Writing

Except where noted, content and user contributions on this site are licensed under CC BY-SA 4.0 with attribution required.