Statistics
Textbooks
Boundless Statistics
Estimation and Hypothesis Testing
Confidence Intervals
Statistics Textbooks Boundless Statistics Estimation and Hypothesis Testing Confidence Intervals
Statistics Textbooks Boundless Statistics Estimation and Hypothesis Testing
Statistics Textbooks Boundless Statistics
Statistics Textbooks
Statistics
Concept Version 10
Created by Boundless

Confidence Interval for a Population Mean, Standard Deviation Not Known

In this section, we outline an example of finding the confidence interval for a population mean when we do not know the standard deviation.

Learning Objective

  • Calculate the confidence interval for the mean when the standard deviation is unknown


Key Points

    • Our example is for a study of acupuncture to determine how effective it is in relieving pain.
    • We measure sensory rates for 15 random subjects, with the results being:8.6, 9.4, 7.9, 6.8, 8.3, 7.3, 9.2, 9.6, 8.7, 11.4, 10.3, 5.4, 8.1, 5.5, 6.9.
    • We want to use the sample data to construct a 95% confidence interval for the mean sensory rate for the populations (assumed normal) from which we took this data.
    • The 95% confidence interval for the mean score is $(7.30, 9.15)$.
    • We are 95% confident that the interval from 7.30 to 9.15 contains the true mean score of all the sensory rates—95% of all confidence intervals constructed in this way contain the true mean sensory rate score.

Terms

  • confidence interval

    A type of interval estimate of a population parameter used to indicate the reliability of an estimate.

  • margin of error

    An expression of the lack of precision in the results obtained from a sample.


Full Text

Step By Step Example of a Confidence Interval for a Mean—Standard Deviation Unknown

Suppose you do a study of acupuncture to determine how effective it is in relieving pain. You measure sensory rates for 15 random subjects with the results given below:

8.6, 9.4, 7.9, 6.8, 8.3, 7.3, 9.2, 9.6, 8.7, 11.4, 10.3, 5.4, 8.1, 5.5, 6.9.

Use the sample data to construct a 95% confidence interval for the mean sensory rate for the populations (assumed normal) from which you took this data.

We have the following guidelines for such a problem:

  1. Plan: State what we need to know.
  2. Model: Think about the assumptions and check the conditions.
  3. State the parameters and the sampling model.
  4. Mechanics: $\text{CL} = 0.95$, so $\alpha = 1-\text{CL} = 1-0.95 = 0.05$. The area to the right of $t_{0.25}$ is $1-0.025 = 0.975$; so $t_{0.025, 14} = 2.14$.
  5. Conclusion: Interpret your result in the proper context, and relate it to the original question.

1. In our example, we are asked to find a 95% confidence interval for the mean sensory rate, $\mu$, of acupuncture subjects. We have a sample of 15 rates. We do not know the population standard deviation.

2. We have the following conditions:

  • Randomization Condition: The sample is a random sample.
  • Independence Assumption: It is reasonable to think that the sensory rates of 15 subjects are independent.
  • 10% Condition: We assume the acupuncture population is over 150, so 15 subjects is less than 10% of the population.
  • Sample Size Condition: Since the distribution of mean sensory rates is normal, our sample of 15 is large enough.
  • Nearly Normal Condition: We should do a box plot and histogram to check this. Even though the data is slightly skewed, it is unimodal (and there are no outliers) so we can use the model.

3. The conditions are satisfied and $\sigma$ is unknown, so we will use a confidence interval for a mean with unknown standard deviation. We need the sample mean and margin of error (ME).

$\overline { x } =8.2267;s=1.6722;n=15;$

$df=15-1=14;\text{ME}={ t }_{ \frac { a }{ 2 } }\left( \frac { 8 }{ \sqrt { n } } \right)$

4. $\text{ME} = 2.14$

$\left( \frac { 1.6722 }{ \sqrt { 15 } } \right) =0.924$

$\overline { x } =\text{ME}=8.2267-0.9240=7.3027$

$\overline { x } =\text{ME}=8.2267+0.9240=9.1507$

The 95% confidence interval for the mean score is $(7.30, 9.15)$.

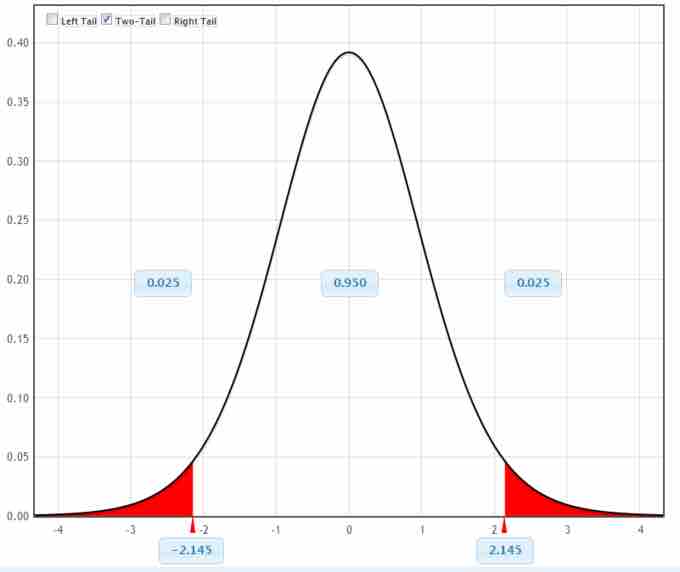
Graphical Representation

This figure is a graphical representation of the confidence interval we calculated in this example.

5. We are 95% confident that the interval from 7.30 to 9.15 contains the true mean score of all the sensory rates. 95% of all confidence intervals constructed in this way contain the true mean sensory rate score.
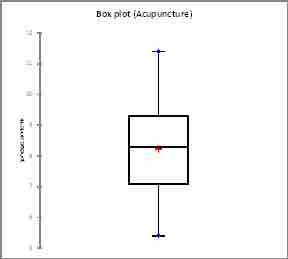
Box Plot

This figure is a box plot for the data set in our example.
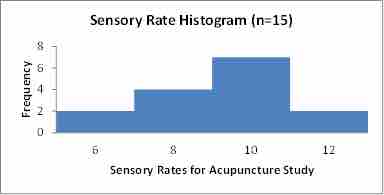
Histogram

This figure is a histogram for the data set in our example.

[ edit ]
Edit this content
Prev Concept
Confidence Interval for a Population Mean, Standard Deviation Known
Estimating a Population Variance
Next Concept
Subjects
  • Accounting
  • Algebra
  • Art History
  • Biology
  • Business
  • Calculus
  • Chemistry
  • Communications
  • Economics
  • Finance
  • Management
  • Marketing
  • Microbiology
  • Physics
  • Physiology
  • Political Science
  • Psychology
  • Sociology
  • Statistics
  • U.S. History
  • World History
  • Writing

Except where noted, content and user contributions on this site are licensed under CC BY-SA 4.0 with attribution required.