Using Multiple Regression for Prediction
Standard multiple regression is the same idea as simple linear regression, except now we have several independent variables predicting the dependent variable. Imagine that we wanted to predict a person's height from the gender of the person and from the weight. We would use standard multiple regression in which gender and weight would be the independent variables and height would be the dependent variable. The resulting output would tell us a number of things. First, it would tell us how much of the variance in height is accounted for by the joint predictive power of knowing a person's weight and gender. This value is denoted by
In addition to telling us the predictive value of the overall model, standard multiple regression tells us how well each independent variable predicts the dependent variable, controlling for each of the other independent variables. In our example, the regression analysis would tell us how well weight predicts a person's height, controlling for gender, as well as how well gender predicts a person's height, controlling for weight.
To see if weight is a "significant" predictor of height, we would look at the significance level associated with weight. Again, significance levels of 0.05 or lower would be considered significant, and significance levels between 0.05 and 0.10 would be considered marginal. Once we have determined that weight is a significant predictor of height, we would want to more closely examine the relationship between the two variables. In other words, is the relationship positive or negative? In this example, we would expect that there would be a positive relationship. In other words, we would expect that the greater a person's weight, the greater the height. (A negative relationship is present in the case in which the greater a person's weight, the shorter the height. ) We can determine the direction of the relationship between weight and height by looking at the regression coefficient associated with weight.
A similar procedure shows us how well gender predicts height. As with weight, we would check to see if gender is a significant predictor of height, controlling for weight. The difference comes when determining the exact nature of the relationship between gender and height. That is, it does not make sense to talk about the effect on height as gender increases or decreases, since gender is not a continuous variable.
Conclusion
As mentioned, the significance levels given for each independent variable indicate whether that particular independent variable is a significant predictor of the dependent variable, over and above the other independent variables. Because of this, an independent variable that is a significant predictor of a dependent variable in simple linear regression may not be significant in multiple regression (i.e., when other independent variables are added into the equation). This could happen because the covariance that the first independent variable shares with the dependent variable could overlap with the covariance that is shared between the second independent variable and the dependent variable. Consequently, the first independent variable is no longer uniquely predictive and would not be considered significant in multiple regression. Because of this, it is possible to get a highly significant
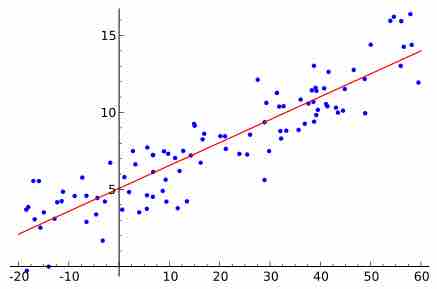
Multiple Regression
This image shows data points and their linear regression. Multiple regression is the same idea as single regression, except we deal with more than one independent variables predicting the dependent variable.