You use multiple regression when you have three or more measurement variables. One of the measurement variables is the dependent (
How It Works
The basic idea is that an equation is found like this:
The
How well the equation fits the data is expressed by
Importance of Slope (Partial Regression Coefficients)
When the purpose of multiple regression is prediction, the important result is an equation containing partial regression coefficients (slopes). If you had the partial regression coefficients and measured the
When the purpose of multiple regression is understanding functional relationships, the important result is an equation containing standard partial regression coefficients, like this:
Where
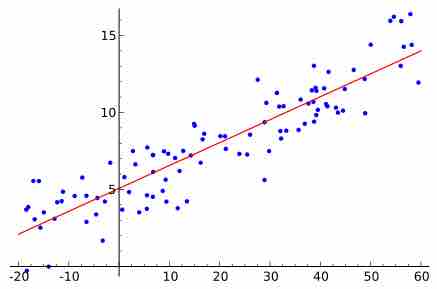
Linear Regression
A graphical representation of a best fit line for simple linear regression.