Algebra
Textbooks
Boundless Algebra
Functions
Introduction to Functions
Algebra Textbooks Boundless Algebra Functions Introduction to Functions
Algebra Textbooks Boundless Algebra Functions
Algebra Textbooks Boundless Algebra
Algebra Textbooks
Algebra
Concept Version 9
Created by Boundless

Graphical Representations of Functions

Graphs are a great visual representation of functions, showing the relationship between the input and output values as lines or curves

Learning Objective

  • Identify how graphing a function is like graphing equations generally


Key Points

    • Functions have an independent variable and a dependent variable. Typically $x$ is the independent variable and $y$ the dependent variable.
    • As you choose any valid value for the independent variable, the dependent variable is determined by the function.
    • To graph a function, choose some values for the independent variable, $x$, plug them into the function to get a set of ordered pairs $(x,f(x))$, and plot these on the graph. Then connect the points to best match how the points are arranged on the graph. Make sure you have enough points.

Terms

  • independent variable

    An independent variable in an equation or function is one whose value is not dependent on any other in the equation or function.

  • dependent variable

    The dependant variable in an equation or function is that whose value depends on one or more independant variables in the equation or function.

  • graph

    A diagram displaying data; in particular one showing the relationship between two or more quantities, measurements, or numbers.


Full Text

Independent and Dependent Variables in Function Notation

Functions have an independent variable and a dependent variable. When we look at a function such as $f(x)=\frac{1}{2}x$, we call the variable that we are changing, in this case $x$, the independent variable. We assign the value of the function to a variable, in this case $y$, that we call the dependent variable.  Function notation, $f(x)$ is read as "$f$ of $x$" which means "the value of the function at $x$."  Since the output, or dependent variable is $y$, for function notation often times $f(x)$ is thought of as $y$.  The ordered pairs normally stated in linear equations as $(x,y)$, in function notation are now written as $(x,f(x))$.

We say that $x$ is independent because we can pick any value for which the function is defined, in this case the set of real numbers $\mathbb{R}$, as inputs into the function. We say the result is assigned to the dependent variable since it depends on what value we placed into the function.

Graphing Functions

Example 1:  Let's start with a simple linear function: 

$\displaystyle f(x)=5-\frac{5}{2}x$.

Start by graphing as if $f(x)$ is a linear equation: 

$\displaystyle y=5-\frac{5}{2}x$  

We choose a few values for the independent variable, $x$.  Let's choose a negative value, zero, and a positive value: 

$\displaystyle x=-2, 0, 2 $. 

Next, substitute these values into the function for $x$, and solve for $f(x)$ (which means the same as the dependent variable $y$):  we get the ordered pairs: 

$\displaystyle (-2,10), (0,5), (2,0)$ 

This function is that of a line, since the highest exponent in the function is a
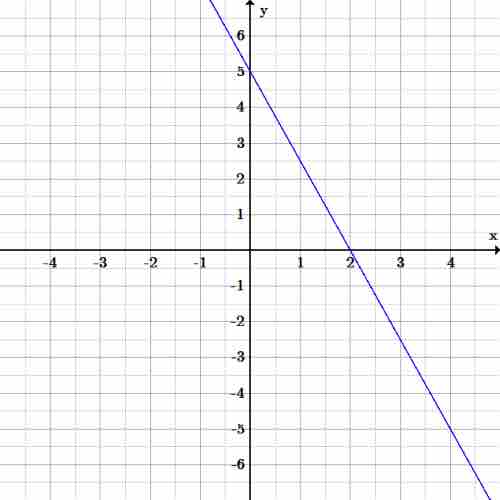
 $1$, so simply connect the three points. Extend them in either direction past the points to infinity, and we have our graph.

Line graph

This is the graph of the function $f(x)=5-\frac{5}{2}x$.  The function is linear, since the highest degree in the function is a $1$.  Only two points are required to graph a linear function.

Example 2:  Graph the function: 

$\displaystyle f(x)=x^{3}-9x$.

Start by choosing values for the independent variable, $x$. This function is more complicated than that of a line so we'll need to choose more points. Let us choose:

$\displaystyle x=\{0, \pm1, \pm2, \pm3, \pm4\}$.

Next, plug these values into the function, $f(x)=x^{3}-9x$, to get a set of ordered pairs, in this case we get the set of ordered pairs:

$\displaystyle \{(-4, -28),(-3,0)(-2,10),(-1,8),(0,0),(1,-8),(2,-10),(3,0),(4,28)\}$.

Next place these points on the graph, and connect them as best as possible with a curve. The graph for this function is below.
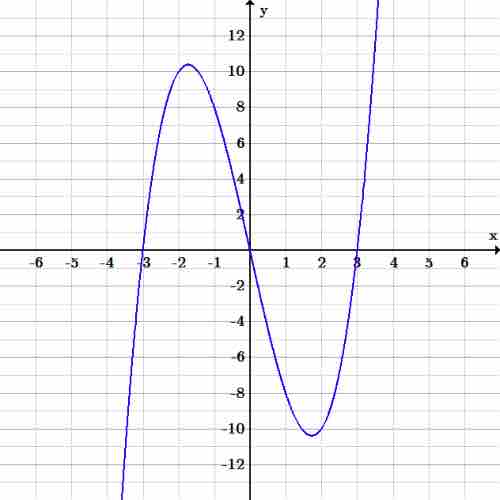
Cubic graph

Graph of the cubic function $f(x)=x^{3}-9x$.  The degree of the function is 3, therefore it is a cubic function.

[ edit ]
Edit this content
Prev Concept
Functions and Their Notation
The Vertical Line Test
Next Concept
Subjects
  • Accounting
  • Algebra
  • Art History
  • Biology
  • Business
  • Calculus
  • Chemistry
  • Communications
  • Economics
  • Finance
  • Management
  • Marketing
  • Microbiology
  • Physics
  • Physiology
  • Political Science
  • Psychology
  • Sociology
  • Statistics
  • U.S. History
  • World History
  • Writing

Except where noted, content and user contributions on this site are licensed under CC BY-SA 4.0 with attribution required.