In mathematics, the vertical line test is a visual way to determine if a curve is a graph of a function, or not. Recall that a function can only have one output,
If a vertical line intersects a curve on an
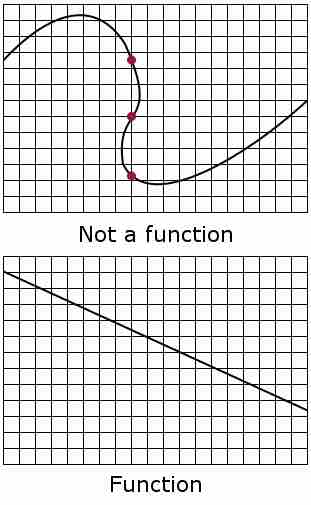
Vertical Line Test
Note that in the top graph, a single vertical line drawn where the red dots are plotted would intersect the curve 3 times. Thus, it fails the vertical line test and does not represent a function. Any vertical line in the bottom graph passes through only once and hence passes the vertical line test, and thus represents a function.
To use the vertical line test, take a ruler or other straight edge and draw a line parallel to the
Example
Refer to the three graphs below,
Applying the Vertical Line Test
Which graphs represent functions?
If any vertical line intersects a graph more than once, the relation
represented by the graph is not a function. Notice that any vertical
line would pass through only one point of the two graphs shown in graphs
Not a Function
The vertical line test demonstrates that a circle is not a function.