This article was co-authored by Michael R. Lewis. Michael R. Lewis is a retired corporate executive, entrepreneur, and investment advisor in Texas. He has over 40 years of experience in business and finance, including as a Vice President for Blue Cross Blue Shield of Texas. He has a BBA in Industrial Management from the University of Texas at Austin.
There are 7 references cited in this article, which can be found at the bottom of the page.
This article has been viewed 657,057 times.
In economics, marginal utility (MU) is a way to measure how much value or satisfaction a consumer gets out of consuming something. As a general rule, MU is equal to the change in total utility divided by the change in the quantity of goods consumed.[1] A common way of thinking of this is that MU is the utility someone gets from each additional unit of goods consumed.
Steps
Using the Marginal Utility Equation
-
1Understand the economic concept of utility. Utility is the "value" or "satisfaction" that a consumer gets from consuming a certain number of goods. A good way of thinking of it is that utility is how much money a consumer would hypothetically pay for the satisfaction provided by a good.[2]
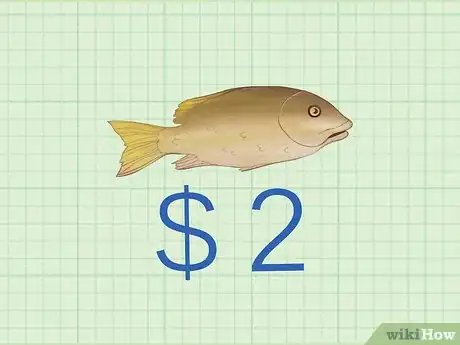
- For example, let's say that you are hungry and are buying fish to eat for supper. Let's also say that one fish costs $2. If you're so hungry that you would pay $8 for the fish, the fish is said to provide $8 worth of utility. In other words, you're willing to pay $8 to get the satisfaction from the fish no matter what it actually costs.
-
2Find the total utility from consuming a certain number of goods. Total utility is just the concept of utility applied to more than one good. If consuming one good gives you a certain amount of utility, consuming more than one of the same good will give you an amount that is higher, lower, or the same.[3]
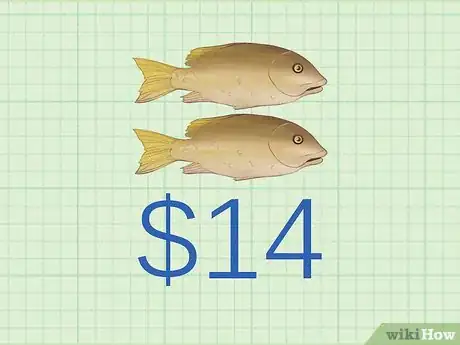
- For example, let's say that you plan to eat two fish. However, after eating the first fish, you're not quite as hungry as before. Now, you'd only pay $6 for the extra satisfaction of the second fish. It's not worth as much to you now that you're somewhat full. This means the two fish provide $6 + $8 (first fish) = $14 of "total utility" together.
- Note that it doesn't matter whether or not you actually buy the second fish. MU is only concerned with what you would pay for it. In real life, economists use complex mathematical models to predict what consumers hypothetically would pay for something.
Advertisement -
3Find the total utility from consuming a different number of goods. To find MU, you need two different total utility measurements. You'll use the difference between them to make your MU calculation.[4]
- Let's say that, in the example situation in Step 2, you decide that you're hungry enough to eat four whole fish. After the second fish, you're feeling a little full, so you would only pay about $3 for the next fish. After the third fish, you're almost completely full, so you would only pay $1 for the final fish.
- The satisfaction you would get from it is almost cancelled out by the feeling of being uncomfortably full. You can say that the four fish provide a total utility of $8 + $6 + $3 + $1 = $18.
-
4Calculate MU. Divide the difference in total utility over the difference in units. The answer you get will be the marginal utility, or the utility given by each additional unit consumed.[5] In the example situation, you would calculate your MU as follows:
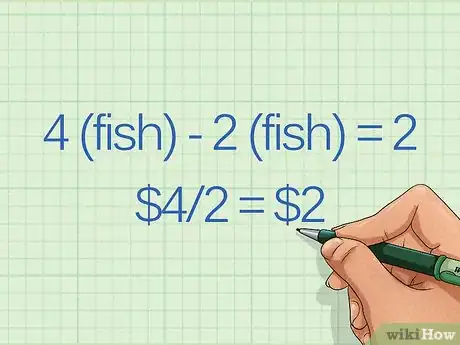
- $18 - $14 (example from Step 2) = $4
- 4 (fish) - 2 (fish) = 2
- $4/2 = $2
- This means that, between the second and the fourth fish, each extra fish is only worth $2 of utility to you. This is an average value; the third fish is actually worth $3 and the fourth is actually worth $1, of course.
Calculating MU for Additional Units
-
1Use the equation to find the MU for each additional unit. In the example above, we found the average MU for several goods being consumed. This is one valid way to use MU. However, it's actually more often applied to individual units of goods consumed. This gives us the precise MU for each additional good (not an average value).[6]
- Finding this is easier than it sounds. Just use the normal equation to find the MU when the change in quantity of goods consumed is one.
- In the example situation, you already know the MUs for each individual unit. When you haven't had any fish, the MU of the first fish is $8 ($8 of total utility - the $0 you had before/change of 1 unit), the MU of the second fish is $6 ($14 of total utility - the $8 you had before/change of 1 unit), and so on.
-
2Use the equation to maximize your utility. In economic theory, consumers make decisions about how to spend their money in an effort to maximize their utility. In other words, consumers want to get as much satisfaction as possible for their money. This means that consumers will tend to buy products or goods until the marginal utility of buying one more good is smaller than the marginal cost (the price of one more unit).[7]
-
3Determine lost utility. Let's look at the example situation one more time. First we said that each fish costs $2. Then we determined that the first fish has an MU of $8, the second has an MU of $6, the third has an MU of $3, and the fourth has an MU of $1.[8]
- Given this information, you wouldn't actually end up buying the fourth fish. Its marginal utility ($1) is less than its marginal cost ($2). Basically, you're losing utility on this transaction, so it's not in your favor.)
Using a Marginal Utility Chart
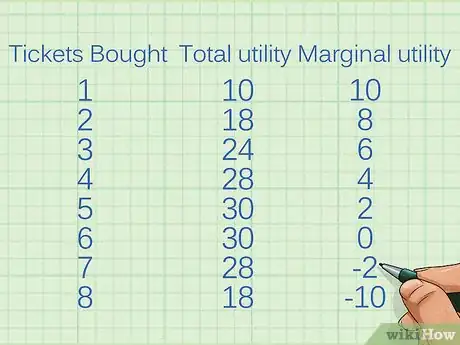
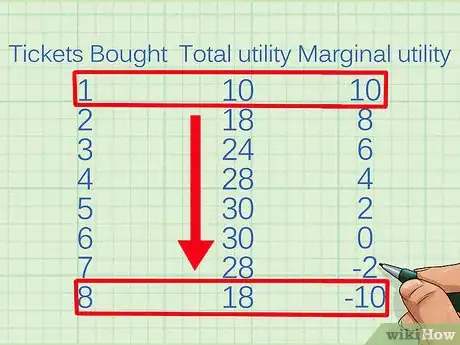
| Tickets Bought | Total utility | Marginal utility |
|---|---|---|
| 1 | 10 | 10 |
| 2 | 18 | 8 |
| 3 | 24 | 6 |
| 4 | 28 | 4 |
| 5 | 30 | 2 |
| 6 | 30 | 0 |
| 7 | 28 | -2 |
| 8 | 18 | -10 |
-
1Assign columns for quantity, total utility, and marginal utility. Most MU charts have at least these three columns. There may sometimes be more, but these display the most crucial information. Typically, these are arranged from left to right.[9]
- Note that the column headers will not always match these exactly. For example, the "Quantity" column may be labeled "Items bought," "Units purchased," or something similar. The important thing is the information in the column.
-
2Look for a trend of diminishing returns. A "classic" MU chart is often used to demonstrate that, as a consumer buys more of a certain good, the desire to purchase even more goods will drop. In other words, after a point, the marginal utility of each additional good purchased will start to decrease. Eventually, the consumer will start to be less satisfied overall than before buying the additional goods.[10]
- In the example chart above, this trend of diminishing returns starts almost immediately. The first ticket to the film festival provides lots of marginal utility, but each ticket after the first gives a little less. After six tickets, each extra ticket actually has a negative MU, which decreases the total satisfaction. An explanation for this might be that, after six visits, the consumer starts to get tired of seeing the same movies again and again.
-
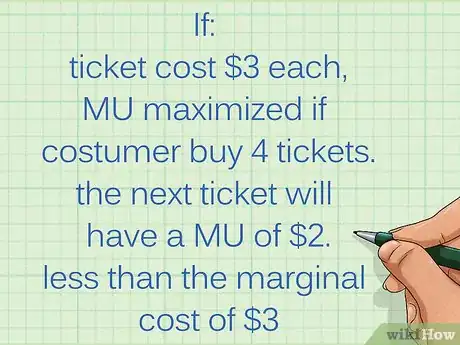
3Determine Maximum Utility. This is the point where marginal price exceeds MU. A marginal utility chart makes it easy to predict how many units of goods a consumer will buy. As a reminder, consumers tend to buy goods until the marginal price (the cost of one more unit of the goods) is greater than the MU. If you know how much the goods being analyzed in the chart cost, the point where utility is maximized is the last row where MU is higher than the marginal cost.[11]
- Let's say that the tickets in the example chart cost $3 each. In this case, utility is maximized when the consumer buys 4 tickets. The next ticket after this has an MU of $2, which is less than the marginal cost of $3.
- Note that utility isn't necessarily maximized when the MU starts to become negative. It's possible for goods to give some benefit to the consumer without being "worth it." For instance, the fifth ticket in the chart above still gives $2 worth of MU. This isn't a negative MU but it still decreases the total utility because it's not worth the cost.
-
4Use the chart data to find additional information. Once you have the three "core" columns above, it becomes easy to get more numerical data about the model situation the chart is analyzing. This is especially true if you're using a spreadsheet program such as Microsoft Excel that can do the math for you. Here are two types of data you may want to put in extra columns to the right of the three used above:[12]
- Average Utility: The total utility in each row divided by the quantity of goods purchased.[13]
- Consumer Surplus: The marginal utility in each row minus the product's marginal cost. It represents the "profit" in terms of utility the consumer gets from buying each product. It is also called "economic surplus."[14]
References
- ↑ http://www.amosweb.com/cgi-bin/awb_nav.pl?s=wpd&c=dsp&k=marginal+utility
- ↑ http://www.investopedia.com/terms/u/utility.asp
- ↑ http://www.investopedia.com/terms/u/utility.asp
- ↑ http://www.investopedia.com/terms/u/utility.asp
- ↑ http://www.investopedia.com/terms/u/utility.asp
- ↑ http://www.harpercollege.edu/mhealy/eco211/lectures/utilmax/util.htm
- ↑ http://www.harpercollege.edu/mhealy/eco211/lectures/utilmax/util.htm
- ↑ http://www.harpercollege.edu/mhealy/eco211/lectures/utilmax/util.htm
- ↑ http://www.investopedia.com/university/economics/economics5.asp
- ↑ http://www.investopedia.com/university/economics/economics5.asp
- ↑ http://www.investopedia.com/university/economics/economics5.asp
- ↑ http://www.investopedia.com/university/economics/economics5.asp
- ↑ http://www.freeeconhelp.com/2012/01/equation-for-total-and-marginal-utility.html
- ↑ http://www.investopedia.com/terms/c/consumer_surplus.asp
- ↑ https://www.theatlantic.com/business/archive/2013/01/the-irrational-consumer-why-economics-is-dead-wrong-about-how-we-make-choices/267255/
About This Article
Marginal utility is used to measure how satisfying or valuable something is to a consumer. To calculate the marginal utility of something, just divide the change in total utility by the change in the number of goods consumed. In other words, divide the difference in total utility by the difference in units to find marginal utility. To learn more from our Entrepreneur co-author, like how to use a marginal utility chart, keep reading the article!
