This article was co-authored by wikiHow staff writer, Hunter Rising. Hunter Rising is a wikiHow Staff Writer based in Los Angeles. He has more than three years of experience writing for and working with wikiHow. Hunter holds a BFA in Entertainment Design from the University of Wisconsin - Stout and a Minor in English Writing.
There are 7 references cited in this article, which can be found at the bottom of the page.
This article has been viewed 47,760 times.
Learn more...
Qualitative data include open-ended answers from questionnaires, surveys, and interviews. Since the data doesn’t have numerical value, you have to sort through the responses to find connections and results. While there isn’t a perfect way to analyze your data, there are still a few guidelines to follow to ensure you draw accurate conclusions. We’ll go over how to find the important information in your results before moving on to some common ways to interpret the data so you can learn from it!
Steps
Identify the key questions you want to answer.
-
Write what you hope to find in your data so you know what to focus on. The questions you choose all depend on your research topic. Think about why you ran the study and come up with a few points that you want to investigate in your results. You only need 1–2 questions starting off since you can always add more or change the old ones as you work through your data.[1] X Research source
- For example, if you’re analyzing customer satisfaction surveys, you could use questions like, “What are customers struggling with the most?” or “What processes are enhancing the customer experience?”
Read your results thoroughly.
-
Familiarize yourself with all the responses to get a deeper understanding. Since qualitative data is all textual, each respondent will have different answers. Carefully read through all of the responses you’ve received so you get a better idea of what sort of information you have. Even if you think you have the gist of the data after the first read, scan through it a few more times to ensure you understand what each response means.[2] X Research source
- Reading qualitative data can take a lot of time, but you’ll get inaccurate results if you rush through it.
Jot down your first impressions.
-
Your initial thoughts on the meanings help you sort data later on. As you read through your data, leave yourself short notes about what the response covers. Take a few seconds to write your interpretation of the responses and how they can answer your research questions. That way, you can quickly reference your notes instead of rereading the response to see what it covers.[3] X Trustworthy Source Centers for Disease Control and Prevention Main public health institute for the US, run by the Dept. of Health and Human Services Go to source
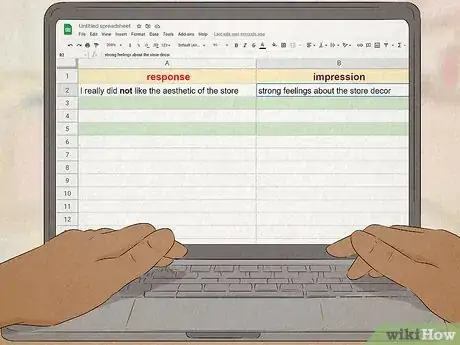
- Keep your responses organized by entering them in a spreadsheet. In one column, copy the full unedited response. In the next column, write your impressions.
Label each data point.
-
Assign shorthand codes to similar themes you find. As you review the results from your research, highlight passages that contain information that answers your research questions. Think about the overarching theme or meaning of each passage and jot down a 1- or 2-word code for it. Write the code down on a separate piece of paper with a reference to what it means so you can use it on other passages as well.[4] X Research source
- For example, if you’re interpreting a customer satisfaction survey, you may use codes like “Positive experience,” “employee issues,” “problems with store,” and so on.
- Avoid using multiple codes that mean the same thing. For example, you probably don’t need a code for “employee attitudes” if you already have “employee issues” written down.
- Use a more general code when you’re first sorting your responses. You can always resort them into more specific codes once you see all the data you’re working with.
Sort data by recurring themes or patterns.
-
Find how the majority responded by rearranging the data into categories. Put all of the results that have the same code into their own separate groups. If you still have responses left over, go through them one at a time and think about the theme of each one. Place the data into the group that has the most similarities, or make a completely new group of information if it isn’t a good fit anywhere else.[5] X Research source [6] X Expert Source

Research & Training Specialist Expert Interview. 2 September 2021.- For example, if multiple responses on a customer satisfaction survey mention things like confusing store layout, disorganized products, and lack of cleanliness, you might sort the responses into a “Store Issues” group.
- Some responses contain multiple passages that fit into different themes. If that’s the case, cut apart the response and sort each passage into the matching group. Always keep a copy of the full response though so you can reference it later on.
- This can take a bit of trial and error before you find the right groupings. Don’t be afraid to try rearranging your responses into new groups if you aren’t finding answers to your questions.
Look for connections between the data themes.
-
Determine if a response to one question influenced any others. Some of the responses you received could have similarities with other groups you’ve sorted them into. Read through the responses in each group and brainstorm ways that they might be connected to one another. Write down your thoughts on a separate piece of paper with some examples or quotes from your responses so you can reference them later.[7] X Trustworthy Source Centers for Disease Control and Prevention Main public health institute for the US, run by the Dept. of Health and Human Services Go to source
- For example, if a response mentions employees don’t give good customer service and another response says the store was messy, you could possibly make a connection that the employees don’t care enough to clean up the store.
Cut outliers and bad data.
-
Only keep the data that answer your research questions. As you sort through your information, keep an eye out for responses that don’t answer your research questions or are completely different from the majority. Since the outliers can skew your results and don’t fit well into categories, avoid including them in the groups that support your findings.[8] X Research source
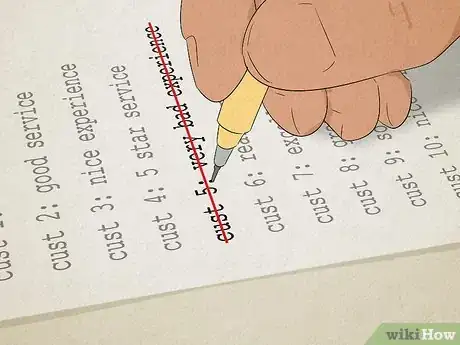
- For example, if only one person complains about how they didn’t get good service, it probably was a one-time occurrence that doesn’t add to your findings.
- Sometimes, outliers can be interesting counterpoints to the majority of your data that you want to address. For example, if a few people complain about struggling with the layout of your store, you may want to investigate if there are small changes you could make.
Use narrative analysis to track overall experience.
-
Reflect on answers as a whole to understand the big picture. Read through the entire response that someone left for your research. When you reach the end of the passage, write down the overarching theme that you interpreted from it. Focus on the order of experiences in the response so you can get an idea of what events and actions occurred.[9] X Research source
- For example, if you’re comparing the overall shopping trips from multiple respondents, you may sort them into overall positive experiences and negative experiences. After that, you can find specific examples in the responses, such as fast service or helpful employees, to find out why a person responded the way they did.
Look for vocal changes in the responses.
-
Tone, hesitation, and word choice affect the meaning of someone’s answer. This works best if you’re working with transcripts or recordings of conversations. Listen to when the people responding change their tone, pause while they’re talking, or construct their sentences. When you find something that intrigues you or answers one of your research questions, jot down your interpretation.[10] X Research source
- For example, if someone pauses for a second before answering a question, you could interpret that they felt unsure or uneasy about the subject.
- As another example, if someone responds with “I really did not like the aesthetic of the store,” and they put emphasis on the word “not,” then you might assume that they have strong feelings about how the store looks.
Analyze the answers by demographic.
-
Check how different groups of people responded to your questions. Rather than going through your data sorting by like responses, try reorganizing the responses based on age, gender, or background. See if the responses are the same or different between people in similar social groups and record any correlations you find.[11] X Research source
- For example, you may sort your data into 17 and under, 18–35, 36–54, and 55+ to see how different generations respond.
- Using demographic data can help you determine if certain groups have different experiences. For example, if you notice a lot of responses from people 17 and under who don’t want to shop at your store, you may try to sell more products that age range is interested in.
Have other people go through your data.
-
Get second opinions so you don’t skew any of your results. Since you’re the one interpreting your results, it’s really easy to develop bias that influences your outcome. Try to avoid bias as much as possible by getting a few other researchers to comb through your data. Ask them if they notice any trends or common themes that you haven’t found. Write down anything the other people recommend so you can continue investigating their findings.[12] X Research source
Warnings
- Sorting qualitative data can be a little biased since you’re interpreting the results, so your research could be subjective.[15] X Trustworthy Source Centers for Disease Control and Prevention Main public health institute for the US, run by the Dept. of Health and Human Services Go to source⧼thumbs_response⧽
You Might Also Like


-Step-17.webp)


References
- ↑ https://deltastate.edu/docs/irp/Analyzing%20Qualitative%20Data.pdf
- ↑ https://www.nngroup.com/articles/thematic-analysis/
- ↑ https://www.cdc.gov/healthyyouth/evaluation/pdf/brief19.pdf
- ↑ https://www.nngroup.com/articles/thematic-analysis/
- ↑ http://eer.engin.umich.edu/wp-content/uploads/sites/443/2019/08/Seidel-Qualitative-Data-Analysis.pdf
- ↑ Jeremiah Kaplan. Research & Training Specialist. Expert Interview. 2 September 2021.
- ↑ https://www.cdc.gov/healthyyouth/evaluation/pdf/brief19.pdf
- ↑ http://toolkit.pellinstitute.org/evaluation-guide/analyze/analyze-qualitative-data/
- ↑ https://www.sagepub.com/sites/default/files/upm-binaries/43454_10.pdf
- ↑ https://www.sagepub.com/sites/default/files/upm-binaries/43454_10.pdf
- ↑ https://deltastate.edu/docs/irp/Analyzing%20Qualitative%20Data.pdf
- ↑ https://www.sagepub.com/sites/default/files/upm-binaries/43454_10.pdf
- ↑ https://deltastate.edu/docs/irp/Analyzing%20Qualitative%20Data.pdf
- ↑ http://toolkit.pellinstitute.org/evaluation-guide/analyze/analyze-qualitative-data/
- ↑ https://www.cdc.gov/healthyyouth/evaluation/pdf/brief19.pdf


Medical Disclaimer
The content of this article is not intended to be a substitute for professional medical advice, examination, diagnosis, or treatment. You should always contact your doctor or other qualified healthcare professional before starting, changing, or stopping any kind of health treatment.
Read More...