Statistics
Textbooks
Boundless Statistics
Sampling
Errors in Sampling
Statistics Textbooks Boundless Statistics Sampling Errors in Sampling
Statistics Textbooks Boundless Statistics Sampling
Statistics Textbooks Boundless Statistics
Statistics Textbooks
Statistics
Concept Version 9
Created by Boundless

Expected Value and Standard Error

Expected value and standard error can provide useful information about the data recorded in an experiment.

Learning Objective

  • Solve for the standard error of a sum and the expected value of a random variable


Key Points

    • The expected value (or expectation, mathematical expectation, EV, mean, or first moment) of a random variable is the weighted average of all possible values that this random variable can take on.
    • The expected value may be intuitively understood by the law of large numbers: the expected value, when it exists, is almost surely the limit of the sample mean as sample size grows to infinity.
    • The standard error is the standard deviation of the sampling distribution of a statistic.
    • The standard error of the sum represents how much one can expect the actual value of a repeated experiment to vary from the expected value of that experiment.

Terms

  • standard deviation

    a measure of how spread out data values are around the mean, defined as the square root of the variance

  • continuous random variable

    obtained from data that can take infinitely many values

  • discrete random variable

    obtained by counting values for which there are no in-between values, such as the integers 0, 1, 2, ….


Full Text

Expected Value

In probability theory, the expected value (or expectation, mathematical expectation, EV, mean, or first moment) of a random variable is the weighted average of all possible values that this random variable can take on. The weights used in computing this average are probabilities in the case of a discrete random variable, or values of a probability density function in the case of a continuous random variable.

The expected value may be intuitively understood by the law of large numbers: the expected value, when it exists, is almost surely the limit of the sample mean as sample size grows to infinity. More informally, it can be interpreted as the long-run average of the results of many independent repetitions of an experiment (e.g. a dice roll). The value may not be expected in the ordinary sense—the "expected value" itself may be unlikely or even impossible (such as having 2.5 children), as is also the case with the sample mean.

The expected value of a random variable can be calculated by summing together all the possible values with their weights (probabilities): 

$E\left [ X \right ]= x_{1}p_{1}+x_{2}p_{2}+...+x_{k}p_{k}$

where $x$ represents a possible value and $p$ represents the probability of that possible value.

Standard Error

The standard error is the standard deviation of the sampling distribution of a statistic. For example, the sample mean is the usual estimator of a population mean. However, different samples drawn from that same population would in general have different values of the sample mean. The standard error of the mean (i.e., of using the sample mean as a method of estimating the population mean) is the standard deviation of those sample means over all possible samples of a given size drawn from the population.
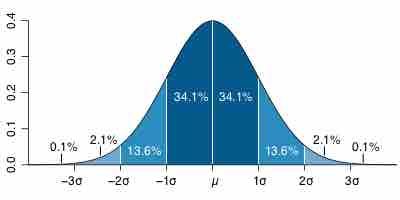
Standard Deviation

This is a normal distribution curve that illustrates standard deviations. The likelihood of being further away from the mean diminishes quickly on both ends.

Expected Value and Standard Error of a Sum

Suppose there are five numbers in a box: 1, 1, 2, 3, and 4. If we were to selected one number from the box, the expected value would be: 

$\displaystyle E\left [ X \right ]= 1\cdot \frac{1}{5}+1\cdot \frac{1}{5}+2\cdot \frac{1}{5}+3\cdot \frac{1}{5}+4\cdot \frac{1}{5}=2.2$

Now, let's say we draw a number from the box 25 times (with replacement). The new expected value of the sum of the numbers can be calculated by the number of draws multiplied by the expected value of the box: $25\cdot 2.2 = 55$. The standard error of the sum can be calculated by the square root of number of draws multiplied by the standard deviation of the box: $\sqrt{25} \cdot \text{SD of box} = 5\cdot 1.17 = 5.8$. This means that if this experiment were to be repeated many times, we could expect the sum of 25 numbers chosen to be within 5.8 of the expected value of 55, either higher or lower.

[ edit ]
Edit this content
Prev Concept
Sampling Distributions and the Central Limit Theorem
Using the Normal Curve
Next Concept
Subjects
  • Accounting
  • Algebra
  • Art History
  • Biology
  • Business
  • Calculus
  • Chemistry
  • Communications
  • Economics
  • Finance
  • Management
  • Marketing
  • Microbiology
  • Physics
  • Physiology
  • Political Science
  • Psychology
  • Sociology
  • Statistics
  • U.S. History
  • World History
  • Writing

Except where noted, content and user contributions on this site are licensed under CC BY-SA 4.0 with attribution required.