Statistics
Textbooks
Boundless Statistics
Other Hypothesis Tests
The t-Test
Statistics Textbooks Boundless Statistics Other Hypothesis Tests The t-Test
Statistics Textbooks Boundless Statistics Other Hypothesis Tests
Statistics Textbooks Boundless Statistics
Statistics Textbooks
Statistics
Concept Version 6
Created by Boundless

The t-Distribution

Student's $t$-distribution arises in estimation problems where the goal is to estimate an unknown parameter when the data are observed with additive errors.

Learning Objective

  • Calculate the Student's $t$-distribution


Key Points

    • Student's $t$-distribution (or simply the $t$-distribution) is a family of continuous probability distributions that arises when estimating the mean of a normally distributed population in situations where the sample size is small and population standard deviation is unknown.
    • The $t$-distribution (for $k$) can be defined as the distribution of the location of the true mean, relative to the sample mean and divided by the sample standard deviation, after multiplying by the normalizing term.
    • The $t$-distribution with $n-1$ degrees of freedom is the sampling distribution of the $t$-value when the samples consist of independent identically distributed observations from a normally distributed population.
    • As the number of degrees of freedom grows, the $t$-distribution approaches the normal distribution with mean $0$ and variance $1$.

Terms

  • confidence interval

    A type of interval estimate of a population parameter used to indicate the reliability of an estimate.

  • Student's t-distribution

    A family of continuous probability distributions that arises when estimating the mean of a normally distributed population in situations where the sample size is small and population standard deviation is unknown.

  • chi-squared distribution

    A distribution with $k$ degrees of freedom is the distribution of a sum of the squares of $k$ independent standard normal random variables.


Full Text

Student's $t$-distribution (or simply the $t$-distribution) is a family of continuous probability distributions that arises when estimating the mean of a normally distributed population in situations where the sample size is small and population standard deviation is unknown. It plays a role in a number of widely used statistical analyses, including the Student's $t$-test for assessing the statistical significance of the difference between two sample means, the construction of confidence intervals for the difference between two population means, and in linear regression analysis.

If we take $k$ samples from a normal distribution with fixed unknown mean and variance, and if we compute the sample mean and sample variance for these $k$ samples, then the $t$-distribution (for $k$) can be defined as the distribution of the location of the true mean, relative to the sample mean and divided by the sample standard deviation, after multiplying by the normalizing term $\sqrt { n }$, where $n$ is the sample size. In this way, the $t$-distribution can be used to estimate how likely it is that the true mean lies in any given range.

The $t$-distribution with $n − 1$ degrees of freedom is the sampling distribution of the $t$-value when the samples consist of independent identically distributed observations from a normally distributed population. Thus, for inference purposes, $t$ is a useful "pivotal quantity" in the case when the mean and variance ($\mu$, $\sigma^2$) are unknown population parameters, in the sense that the $t$-value has then a probability distribution that depends on neither $\mu$ nor $\sigma^2$.

History

The $t$-distribution was first derived as a posterior distribution in 1876 by Helmert and Lüroth. In the English-language literature it takes its name from William Sealy Gosset's 1908 paper in Biometrika under the pseudonym "Student." Gosset worked at the Guinness Brewery in Dublin, Ireland, and was interested in the problems of small samples, for example of the chemical properties of barley where sample sizes might be as small as three participants. Gosset's paper refers to the distribution as the "frequency distribution of standard deviations of samples drawn from a normal population." It became well known through the work of Ronald A. Fisher, who called the distribution "Student's distribution" and referred to the value as $t$.

Distribution of a Test Statistic

Student's $t$-distribution with $\nu$ degrees of freedom can be defined as the distribution of the random variable $T$:

$T=\dfrac{Z}{\sqrt{V/ \nu}} = Z \sqrt{\dfrac{\nu}{V}}$

where:

  • $Z$ is normally distributed with expected value $0$ and variance $1$
  • V has a chi-squared distribution with $\nu$ degrees of freedom
  • $Z$and $V$ are independent

A different distribution is defined as that of the random variable defined, for a given constant $\mu$, by:

$\left( Z+\mu \right) \sqrt { \dfrac { \nu }{ V } }$

This random variable has a noncentral $t$-distribution with noncentrality parameter $\mu$. This distribution is important in studies of the power of Student's $t$-test.

Shape

The probability density function is symmetric; its overall shape resembles the bell shape of a normally distributed variable with mean
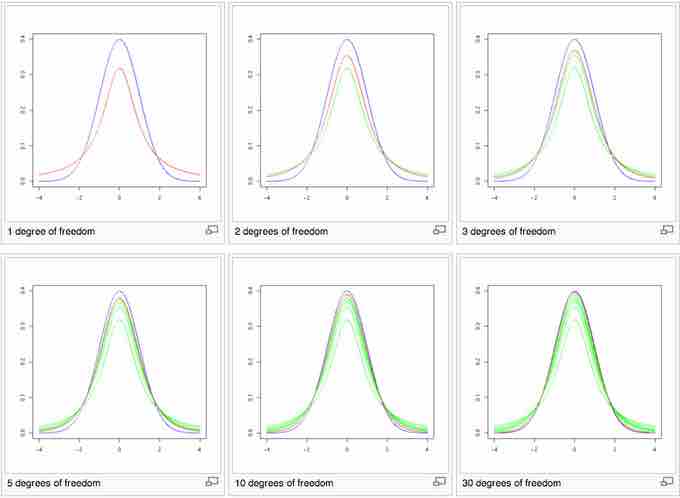
 $0$ and variance $1$, except that it is a bit lower and wider. In more technical terms, it has heavier tails, meaning that it is more prone to producing values that fall far from its mean. This makes it useful for understanding the statistical behavior of certain types of ratios of random quantities, in which variation in the denominator is amplified and may produce outlying values when the denominator of the ratio falls close to zero. As the number of degrees of freedom grows, the $t$-distribution approaches the normal distribution with mean $0$ and variance $1$.

Shape of the $t$-Distribution

These images show the density of the $t$-distribution (red) for increasing values of $\nu$ (1, 2, 3, 5, 10, and 30 degrees of freedom). The normal distribution is shown as a blue line for comparison. Previous plots are shown in green. Note that the $t$-distribution becomes closer to the normal distribution as $\nu$ increases.

Uses

Student's $t$-distribution arises in a variety of statistical estimation problems where the goal is to estimate an unknown parameter, such as a mean value, in a setting where the data are observed with additive errors. If (as in nearly all practical statistical work) the population standard deviation of these errors is unknown and has to be estimated from the data, the $t$-distribution is often used to account for the extra uncertainty that results from this estimation. In most such problems, if the standard deviation of the errors were known, a normal distribution would be used instead of the $t$-distribution.

Confidence intervals and hypothesis tests are two statistical procedures in which the quantiles of the sampling distribution of a particular statistic (e.g., the standard score) are required. In any situation where this statistic is a linear function of the data, divided by the usual estimate of the standard deviation, the resulting quantity can be rescaled and centered to follow Student's $t$-distribution. Statistical analyses involving means, weighted means, and regression coefficients all lead to statistics having this form.

A number of statistics can be shown to have $t$-distributions for samples of moderate size under null hypotheses that are of interest, so that the $t$-distribution forms the basis for significance tests. For example, the distribution of Spearman's rank correlation coefficient $\rho$, in the null case (zero correlation) is well approximated by the $t$-distribution for sample sizes above about $20$.

[ edit ]
Edit this content
Prev Concept
The t-Test
Assumptions
Next Concept
Subjects
  • Accounting
  • Algebra
  • Art History
  • Biology
  • Business
  • Calculus
  • Chemistry
  • Communications
  • Economics
  • Finance
  • Management
  • Marketing
  • Microbiology
  • Physics
  • Physiology
  • Political Science
  • Psychology
  • Sociology
  • Statistics
  • U.S. History
  • World History
  • Writing

Except where noted, content and user contributions on this site are licensed under CC BY-SA 4.0 with attribution required.