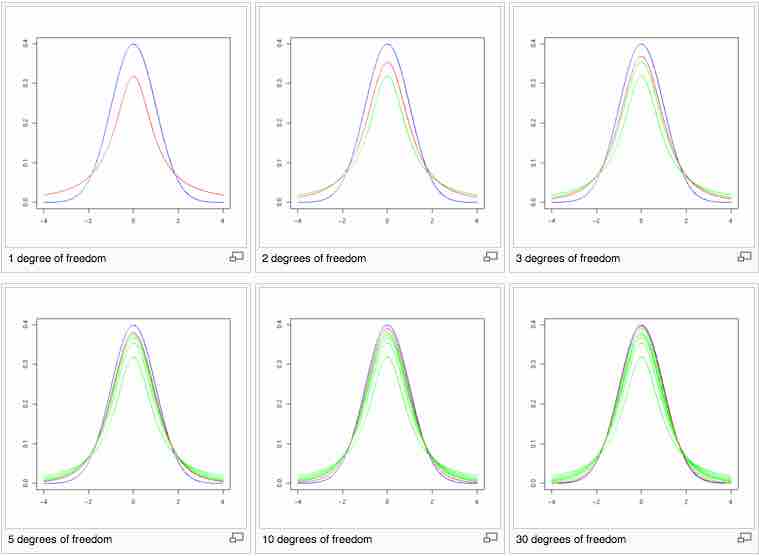
Statistics
Textbooks
Boundless Statistics
Other Hypothesis Tests
The t-Test
Statistics Textbooks Boundless Statistics Other Hypothesis Tests The t-Test
Statistics Textbooks Boundless Statistics Other Hypothesis Tests
Statistics Textbooks Boundless Statistics
Statistics Textbooks
Statistics
Concept Version 6
Created by Boundless

The t-Distribution

Shape of the $t$-Distribution

Shape of the $t$-Distribution

These images show the density of the $t$-distribution (red) for increasing values of $\nu$ (1, 2, 3, 5, 10, and 30 degrees of freedom). The normal distribution is shown as a blue line for comparison. Previous plots are shown in green. Note that the $t$-distribution becomes closer to the normal distribution as $\nu$ increases.

Source

    Boundless vets and curates high-quality, openly licensed content from around the Internet. This particular resource used the following sources:

    "Student's t-distribution."
    https://en.wikipedia.org/wiki/Student's_t-distribution Wikipedia CC BY-SA.

Related Terms

  • confidence interval
  • Student's t-distribution
  • chi-squared distribution
  • Subjects
    • Accounting
    • Algebra
    • Art History
    • Biology
    • Business
    • Calculus
    • Chemistry
    • Communications
    • Economics
    • Finance
    • Management
    • Marketing
    • Microbiology
    • Physics
    • Physiology
    • Political Science
    • Psychology
    • Sociology
    • Statistics
    • U.S. History
    • World History
    • Writing

    Except where noted, content and user contributions on this site are licensed under CC BY-SA 4.0 with attribution required.