Cochran's $Q$ Test
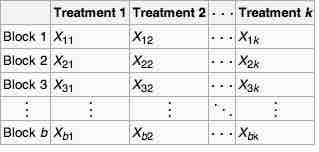
In the analysis of two-way randomized block designs, where the response variable can take only two possible outcomes (coded as
Cochran's $Q$
Cochran's
Cochran's
The Cochran's
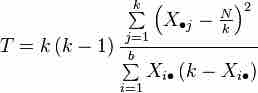
Cochran's $Q$ Test Statistic
This is the equation for Cochran's
where
-
$k$ is the number of treatments - X• j is the column total for the jth treatment
- b is the number of blocks
- Xi • is the row total for the ith block
- N is the grand total
For significance level
where
Cochran's
- A large sample approximation; in particular, it assumes that
$b$ is "large." - The blocks were randomly selected from the population of all possible blocks.
- The outcomes of the treatments can be coded as binary responses (i.e., a
$0$ or$1$ ) in a way that is common to all treatments within each block.
The Friedman Test
The Friedman test is a non-parametric statistical test developed by the U.S. economist Milton Friedman. Similar to the parametric repeated measures ANOVA, it is used to detect differences in treatments across multiple test attempts. The procedure involves ranking each row (or block) together, then considering the values of ranks by columns.
Examples of use could include:
-
$n$ wine judges each rate$k$ different wines. Are any wines ranked consistently higher or lower than the others? -
$n$ welders each use$k$ welding torches, and the ensuing welds were rated on quality. Do any of the torches produce consistently better or worse welds?
Method
1. Given data
2. Find the values:
3. The test statistic is given by
4. Finally, when