Statistics
Textbooks
Boundless Statistics
Measures of Variation
Describing Variability
Statistics Textbooks Boundless Statistics Measures of Variation Describing Variability
Statistics Textbooks Boundless Statistics Measures of Variation
Statistics Textbooks Boundless Statistics
Statistics Textbooks
Statistics
Concept Version 9
Created by Boundless

Standard Deviation: Definition and Calculation

Standard deviation is a measure of the average distance between the values of the data in the set and the mean.

Learning Objective

  • Contrast the usefulness of variance and standard deviation


Key Points

    • A low standard deviation indicates that the data points tend to be very close to the mean; a high standard deviation indicates that the data points are spread out over a large range of values.
    • In addition to expressing the variability of a population, standard deviation is commonly used to measure confidence in statistical conclusions.
    • To calculate the population standard deviation, first compute the difference of each data point from the mean, and square the result of each. Next, compute the average of these values, and take the square root.
    • The standard deviation is a "natural" measure of statistical dispersion if the center of the data is measured about the mean because the standard deviation from the mean is smaller than from any other point.

Terms

  • normal distribution

    A family of continuous probability distributions such that the probability density function is the normal (or Gaussian) function.

  • coefficient of variation

    The ratio of the standard deviation to the mean.

  • mean squared error

    A measure of the average of the squares of the "errors"; the amount by which the value implied by the estimator differs from the quantity to be estimated.

  • standard deviation

    a measure of how spread out data values are around the mean, defined as the square root of the variance


Example

    • The average height for adult men in the United States is about 70 inches, with a standard deviation of around 3 inches. This means that most men (about 68%, assuming a normal distribution) have a height within 3 inches of the mean (67–73 inches) – one standard deviation – and almost all men (about 95%) have a height within 6 inches of the mean (64–76 inches) – two standard deviations. If the standard deviation were zero, then all men would be exactly 70 inches tall. If the standard deviation were 20 inches, then men would have much more variable heights, with a typical range of about 50–90 inches. Three standard deviations account for 99.7% of the sample population being studied, assuming the distribution is normal (bell-shaped).

Full Text

Since the variance is a squared quantity, it cannot be directly compared to the data values or the mean value of a data set. It is therefore more useful to have a quantity that is the square root of the variance. The standard error is an estimate of how close to the population mean your sample mean is likely to be, whereas the standard deviation is the degree to which individuals within the sample differ from the sample mean. This quantity is known as the standard deviation.

Standard deviation (represented by the symbol sigma, $\sigma$) shows how much variation or dispersion exists from the average (mean), or expected value. More precisely, it is a measure of the average distance between the values of the data in the set and the mean. A low standard deviation indicates that the data points tend to be very close to the mean; a high standard deviation indicates that the data points are spread out over a large range of values. A useful property of standard deviation is that, unlike variance, it is expressed in the same units as the data.

In statistics, the standard deviation is the most common measure of statistical dispersion. However, in addition to expressing the variability of a population, standard deviation is commonly used to measure confidence in statistical conclusions. For example, the margin of error in polling data is determined by calculating the expected standard deviation in the results if the same poll were to be conducted multiple times.

Basic Calculation

Consider a population consisting of the following eight values:

2, 4, 4, 4, 5, 5, 7, 9

These eight data points have a mean (average) of 5:

$\displaystyle \frac{2+4+4+4+5+5+7+9}{8} = 5$

To calculate the population standard deviation, first compute the difference of each data point from the mean, and square the result of each:

$(2-5)^2 = 9 \\ (4-5)^2 = 1 \\ (4-5)^2 = 1 \\ (4-5)^2 = 1\\ (5-5)^2 = 0 \\ (5-5)^2 = 0 \\ (7-5)^2 = 4 \\ (9-5)^2 = 16 $

Next, compute the average of these values, and take the square root:

$\displaystyle \sqrt{\frac{9+1+1+1+0+0+4+16}{8}} = 2$

This quantity is the population standard deviation, and is equal to the square root of the variance. The formula is valid only if the eight values we began with form the complete population. If the values instead were a random sample drawn from some larger parent population, then we would have divided by 7 (which is $n-1$) instead of 8 (which is $n$) in the denominator of the last formula, and then the quantity thus obtained would be called the sample standard deviation.

Estimation

The sample standard deviation, $s$, is a statistic known as an estimator. In cases where the standard deviation of an entire population cannot be found, it is estimated by examining a random sample taken from the population and computing a statistic of the sample. Unlike the estimation of the population mean, for which the sample mean is a simple estimator with many desirable properties (unbiased, efficient, maximum likelihood), there is no single estimator for the standard deviation with all these properties. Therefore, unbiased estimation of standard deviation is a very technically involved problem.

As mentioned above, most often the standard deviation is estimated using the corrected sample standard deviation (using $N-1$). However, other estimators are better in other respects:

  • Using the uncorrected estimator (using $N$) yields lower mean squared error.
  • Using $N-1.5$ (for the normal distribution) almost completely eliminates bias.

Relationship with the Mean

The mean and the standard deviation of a set of data are usually reported together. In a certain sense, the standard deviation is a "natural" measure of statistical dispersion if the center of the data is measured about the mean. This is because the standard deviation from the mean is smaller than from any other point. Variability can also be measured by the coefficient of variation, which is the ratio of the standard deviation to the mean.

Often, we want some information about the precision of the mean we obtained. We can obtain this by determining the standard deviation of the sampled mean, which is the standard deviation divided by the square root of the total amount of numbers in a data set:

$\displaystyle \sigma_{\text{mean}} = \frac{\sigma}{\sqrt{N}}$

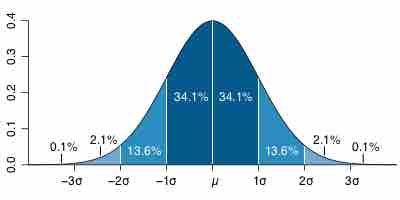
Standard Deviation Diagram

Dark blue is one standard deviation on either side of the mean. For the normal distribution, this accounts for 68.27 percent of the set; while two standard deviations from the mean (medium and dark blue) account for 95.45 percent; three standard deviations (light, medium, and dark blue) account for 99.73 percent; and four standard deviations account for 99.994 percent.

[ edit ]
Edit this content
Prev Concept
Variance
Interpreting the Standard Deviation
Next Concept
Subjects
  • Accounting
  • Algebra
  • Art History
  • Biology
  • Business
  • Calculus
  • Chemistry
  • Communications
  • Economics
  • Finance
  • Management
  • Marketing
  • Microbiology
  • Physics
  • Physiology
  • Political Science
  • Psychology
  • Sociology
  • Statistics
  • U.S. History
  • World History
  • Writing

Except where noted, content and user contributions on this site are licensed under CC BY-SA 4.0 with attribution required.