Statistics
Textbooks
Boundless Statistics
Measures of Variation
Describing Variability
Statistics Textbooks Boundless Statistics Measures of Variation Describing Variability
Statistics Textbooks Boundless Statistics Measures of Variation
Statistics Textbooks Boundless Statistics
Statistics Textbooks
Statistics
Concept Version 7
Created by Boundless

Interpreting the Standard Deviation

The practical value of understanding the standard deviation of a set of values is in appreciating how much variation there is from the mean.

Learning Objective

  • Derive standard deviation to measure the uncertainty in daily life examples


Key Points

    • A large standard deviation indicates that the data points are far from the mean, and a small standard deviation indicates that they are clustered closely around the mean.
    • When deciding whether measurements agree with a theoretical prediction, the standard deviation of those measurements is of crucial importance.
    • In finance, standard deviation is often used as a measure of the risk associated with price-fluctuations of a given asset (stocks, bonds, property, etc. ), or the risk of a portfolio of assets.

Terms

  • disparity

    the state of being unequal; difference

  • standard deviation

    a measure of how spread out data values are around the mean, defined as the square root of the variance


Example

    • In finance, standard deviation is often used as a measure of the risk associated with price-fluctuations of a given asset (stocks, bonds, property, etc.), or the risk of a portfolio of assets. Risk is an important factor in determining how to efficiently manage a portfolio of investments because it determines the variation in returns on the asset and/or portfolio and gives investors a mathematical basis for investment decisions. When evaluating investments, investors should estimate both the expected return and the uncertainty of future returns. Standard deviation provides a quantified estimate of the uncertainty of future returns.

Full Text

A large standard deviation, which is the square root of the variance, indicates that the data points are far from the mean, and a small standard deviation indicates that they are clustered closely around the mean. For example, each of the three populations $\{0, 0, 14, 14\}$, $\{0, 6, 8, 14\}$, and $\{6, 6, 8, 8\}$ has a mean of 7. Their standard deviations are 7, 5, and 1, respectively. The third population has a much smaller standard deviation than the other two because its values are all close to 7.

Standard deviation may serve as a measure of uncertainty. In physical science, for example, the reported standard deviation of a group of repeated measurements gives the precision of those measurements. When deciding whether measurements agree with a theoretical prediction, the standard deviation of those measurements is of crucial importance. If the mean of the measurements is too far away from the prediction (with the distance measured in standard deviations), then the theory being tested probably needs to be revised. This makes sense since they fall outside the range of values that could reasonably be expected to occur, if the prediction were correct and the standard deviation appropriately quantified.

Application of the Standard Deviation

The practical value of understanding the standard deviation of a set of values is in appreciating how much variation there is from the average (mean).

Climate

As a simple example, consider the average daily maximum temperatures for two cities, one inland and one on the coast. It is helpful to understand that the range of daily maximum temperatures for cities near the coast is smaller than for cities inland. Thus, while these two cities may each have the same average maximum temperature, the standard deviation of the daily maximum temperature for the coastal city will be less than that of the inland city as, on any particular day, the actual maximum temperature is more likely to be farther from the average maximum temperature for the inland city than for the coastal one.

Sports

Another way of seeing it is to consider sports teams. In any set of categories, there will be teams that rate highly at some things and poorly at others. Chances are, the teams that lead in the standings will not show such disparity but will perform well in most categories. The lower the standard deviation of their ratings in each category, the more balanced and consistent they will tend to be. Teams with a higher standard deviation, however, will be more unpredictable.

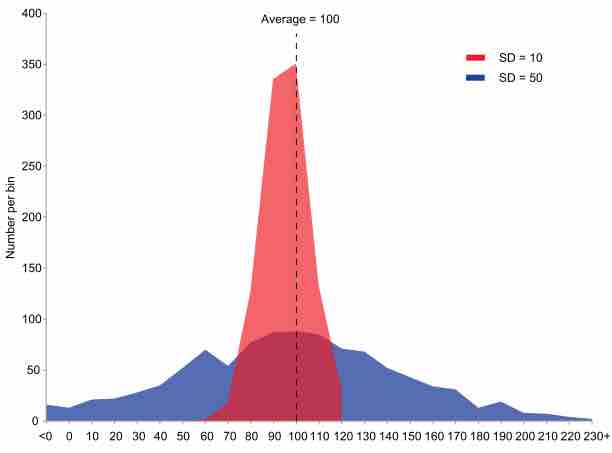
Comparison of Standard Deviations

Example of two samples with the same mean and different standard deviations. The red sample has a mean of 100 and a SD of 10; the blue sample has a mean of 100 and a SD of 50. Each sample has 1,000 values drawn at random from a Gaussian distribution with the specified parameters.

[ edit ]
Edit this content
Prev Concept
Standard Deviation: Definition and Calculation
Using a Statistical Calculator
Next Concept
Subjects
  • Accounting
  • Algebra
  • Art History
  • Biology
  • Business
  • Calculus
  • Chemistry
  • Communications
  • Economics
  • Finance
  • Management
  • Marketing
  • Microbiology
  • Physics
  • Physiology
  • Political Science
  • Psychology
  • Sociology
  • Statistics
  • U.S. History
  • World History
  • Writing

Except where noted, content and user contributions on this site are licensed under CC BY-SA 4.0 with attribution required.