Statistics
Textbooks
Boundless Statistics
Frequency Distributions
Frequency Distributions for Quantitative Data
Statistics Textbooks Boundless Statistics Frequency Distributions Frequency Distributions for Quantitative Data
Statistics Textbooks Boundless Statistics Frequency Distributions
Statistics Textbooks Boundless Statistics
Statistics Textbooks
Statistics
Concept Version 5
Created by Boundless

Z-Scores and Location in a Distribution

A $z$-score is the signed number of standard deviations an observation is above the mean of a distribution.

Learning Objective

  • Define $z$-scores and demonstrate how they are converted from raw scores


Key Points

    • A positive $z$-score represents an observation above the mean, while a negative $z$-score represents an observation below the mean.
    • We obtain a $z$-score through a conversion process known as standardizing or normalizing.
    • $z$-scores are most frequently used to compare a sample to a standard normal deviate (standard normal distribution, with $\mu = 0$ and $\sigma =1$).
    • While $z$-scores can be defined without assumptions of normality, they can only be defined if one knows the population parameters.
    • $z$-scores provide an assessment of how off-target a process is operating.

Terms

  • Student's t-statistic

    a ratio of the departure of an estimated parameter from its notional value and its standard error

  • z-score

    The standardized value of observation $x$ from a distribution that has mean $\mu$ and standard deviation $\sigma$.

  • raw score

    an original observation that has not been transformed to a $z$-score


Full Text

A $z$-score is the signed number of standard deviations an observation is above the mean of a distribution. Thus, a positive $z$-score represents an observation above the mean, while a negative $z$-score represents an observation below the mean. We obtain a $z$-score through a conversion process known as standardizing or normalizing.

$z$-scores are also called standard scores, $z$-values, normal scores or standardized variables. The use of "$z$" is because the normal distribution is also known as the "$z$ distribution." $z$-scores are most frequently used to compare a sample to a standard normal deviate (standard normal distribution, with $\mu = 0$ and $\sigma =1$).

While $z$-scores can be defined without assumptions of normality, they can only be defined if one knows the population parameters. If one only has a sample set, then the analogous computation with sample mean and sample standard deviation yields the Student's $t$-statistic.

Calculation From a Raw Score

A raw score is an original datum, or observation, that has not been transformed. This may include, for example, the original result obtained by a student on a test (i.e., the number of correctly answered items) as opposed to that score after transformation to a standard score or percentile rank. The $z$-score, in turn, provides an assessment of how off-target a process is operating.

The conversion of a raw score, $x$, to a $z$-score can be performed using the following equation:

$z=\dfrac { x-\mu }{ \sigma }$

where $\mu$ is the mean of the population and $\sigma$ is the standard deviation of the population. The absolute value of $z$ represents the distance between the raw score and the population mean in units of the standard deviation. $z$ is negative when the raw score is below the mean and positive when the raw score is above the mean.

A key point is that calculating $z$ requires the population mean and the population standard deviation, not the sample mean nor sample deviation. It requires knowing the population parameters, not the statistics of a sample drawn from the population of interest. However, in cases where it is impossible to measure every member of a population, the standard deviation may be estimated using a random sample.

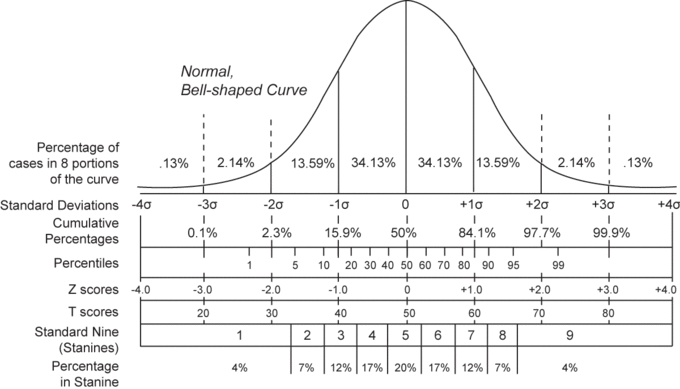
Normal Distribution and Scales

Shown here is a chart comparing the various grading methods in a normal distribution. $z$-scores for this standard normal distribution can be seen in between percentiles and $t$-scores.

[ edit ]
Edit this content
Prev Concept
Typical Shapes
Describing Qualitative Data
Next Concept
Subjects
  • Accounting
  • Algebra
  • Art History
  • Biology
  • Business
  • Calculus
  • Chemistry
  • Communications
  • Economics
  • Finance
  • Management
  • Marketing
  • Microbiology
  • Physics
  • Physiology
  • Political Science
  • Psychology
  • Sociology
  • Statistics
  • U.S. History
  • World History
  • Writing

Except where noted, content and user contributions on this site are licensed under CC BY-SA 4.0 with attribution required.