Distribution Shapes
In statistics, distributions can take on a variety of shapes. Considerations of the shape of a distribution arise in statistical data analysis, where simple quantitative descriptive statistics and plotting techniques, such as histograms, can lead to the selection of a particular family of distributions for modelling purposes.
Symmetrical Distributions
In a symmetrical distribution, the two sides of the distribution are mirror images of each other. A normal distribution is an example of a truly symmetric distribution of data item values. When a histogram is constructed on values that are normally distributed, the shape of the columns form a symmetrical bell shape. This is why this distribution is also known as a "normal curve" or "bell curve. " In a true normal distribution, the mean and median are equal, and they appear in the center of the curve. Also, there is only one mode, and most of the data are clustered around the center. The more extreme values on either side of the center become more rare as distance from the center increases. About 68% of values lie within one standard deviation (σ) away from the mean, about 95% of the values lie within two standard deviations, and about 99.7% lie within three standard deviations . This is known as the empirical rule or the 3-sigma rule.
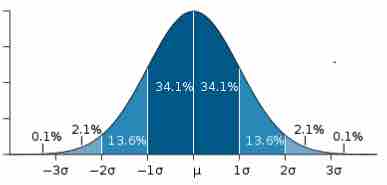
Normal Distribution
This image shows a normal distribution. About 68% of data fall within one standard deviation, about 95% fall within two standard deviations, and 99.7% fall within three standard deviations.
Asymmetrical Distributions
In an asymmetrical distribution, the two sides will not be mirror images of each other. Skewness is the tendency for the values to be more frequent around the high or low ends of the x-axis. When a histogram is constructed for skewed data, it is possible to identify skewness by looking at the shape of the distribution.
A distribution is said to be positively skewed (or skewed to the right) when the tail on the right side of the histogram is longer than the left side. Most of the values tend to cluster toward the left side of the x-axis (i.e., the smaller values) with increasingly fewer values at the right side of the x-axis (i.e., the larger values). In this case, the median is less than the mean .
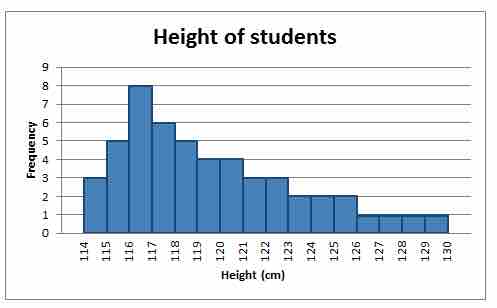
Positively Skewed Distribution
This distribution is said to be positively skewed (or skewed to the right) because the tail on the right side of the histogram is longer than the left side.
A distribution is said to be negatively skewed (or skewed to the left) when the tail on the left side of the histogram is longer than the right side. Most of the values tend to cluster toward the right side of the x-axis (i.e., the larger values), with increasingly less values on the left side of the x-axis (i.e., the smaller values). In this case, the median is greater than the mean .
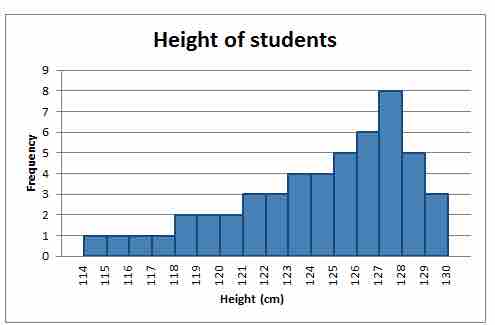
Negatively Skewed Distribution
This distribution is said to be negatively skewed (or skewed to the left) because the tail on the left side of the histogram is longer than the right side.
When data are skewed, the median is usually a more appropriate measure of central tendency than the mean.
Other Distribution Shapes
A uni-modal distribution occurs if there is only one "peak" (or highest point) in the distribution, as seen previously in the normal distribution. This means there is one mode (a value that occurs more frequently than any other) for the data. A bi-modal distribution occurs when there are two modes. Multi-modal distributions with more than two modes are also possible.