Statistics
Textbooks
Boundless Statistics
Estimation and Hypothesis Testing
One-Way ANOVA
Statistics Textbooks Boundless Statistics Estimation and Hypothesis Testing One-Way ANOVA
Statistics Textbooks Boundless Statistics Estimation and Hypothesis Testing
Statistics Textbooks Boundless Statistics
Statistics Textbooks
Statistics
Concept Version 9
Created by Boundless

The One-Way F-Test
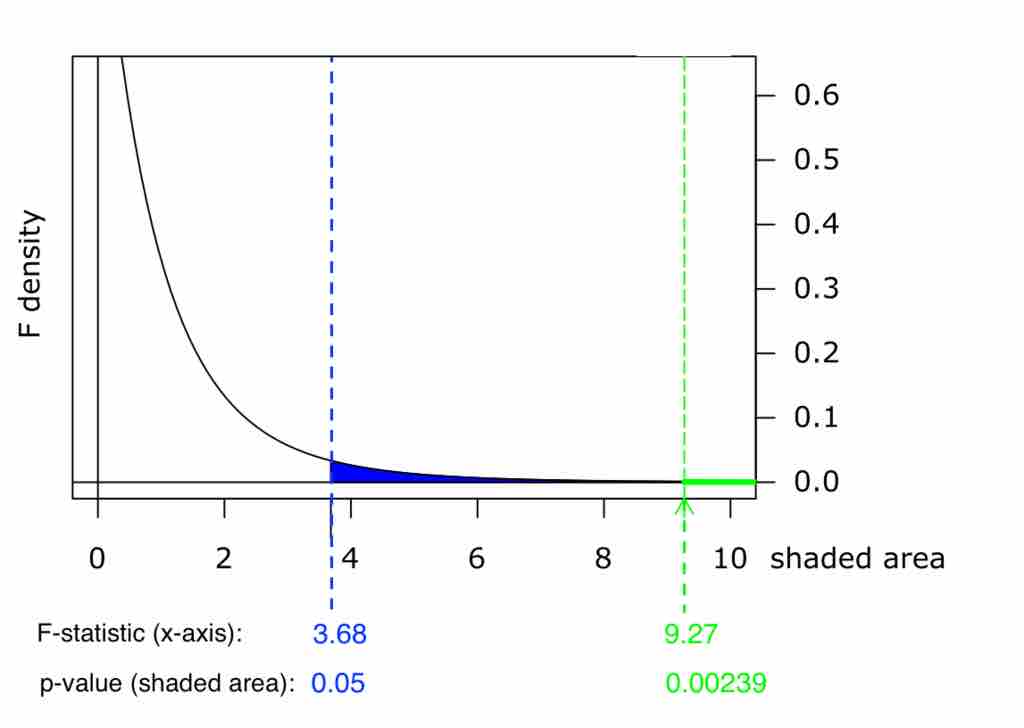
Graph of $p$-Value

Graph of $p$-Value

This chart shows example p-values for two F-statistics: p = 0.05 for F = 3.68, and p = 0.00239 for F = 9.27. These numbers are evidence of the skewness of the F-curve to the right; a much higher F-value corresponds to an only slightly smaller p-value.

Source

    Boundless vets and curates high-quality, openly licensed content from around the Internet. This particular resource used the following sources:

    "F-dens-2-15df.svg.png."
    https://commons.wikimedia.org/wiki/File:F-dens-2-15df.svg Wikimedia CC BY-SA 3.0.

Related Terms

  • ANOVA
  • F-Test
  • omnibus
  • Subjects
    • Accounting
    • Algebra
    • Art History
    • Biology
    • Business
    • Calculus
    • Chemistry
    • Communications
    • Economics
    • Finance
    • Management
    • Marketing
    • Microbiology
    • Physics
    • Physiology
    • Political Science
    • Psychology
    • Sociology
    • Statistics
    • U.S. History
    • World History
    • Writing

    Except where noted, content and user contributions on this site are licensed under CC BY-SA 4.0 with attribution required.