Statistics
Textbooks
Boundless Statistics
Estimation and Hypothesis Testing
Hypothesis Testing: Two Samples
Statistics Textbooks Boundless Statistics Estimation and Hypothesis Testing Hypothesis Testing: Two Samples
Statistics Textbooks Boundless Statistics Estimation and Hypothesis Testing
Statistics Textbooks Boundless Statistics
Statistics Textbooks
Statistics
Concept Version 8
Created by Boundless

Determining Sample Size

A common problem is calculating the sample size required to yield a certain power for a test, given a predetermined type I error rate $\alpha$.

Learning Objective

  • Calculate the appropriate sample size required to yield a certain power for a hypothesis test by using predetermined tables, Mead's resource equation or the cumulative distribution function.


Key Points

    • In a hypothesis test, sample size can be estimated by pre-determined tables for certain values, by Mead's resource equation, or, more generally, by the cumulative distribution function.
    • Using desired statistical power and Cohen's $D$ in a table can yield an appropriate sample size for a hypothesis test.
    • Mead's equation may not be as accurate as using other methods in estimating sample size, but gives a hint of what is the appropriate sample size where parameters such as expected standard deviations or expected differences in values between groups are unknown or very hard to estimate.
    • In a hypothesis test, sample size can be estimated by pre-determined tables for certain values, by Mead's resource equation, or, more generally, by the cumulative distribution function.

Terms

  • Mead's resource equation

    $E=N-B-T$: an equation that gives a hint of what the appropriate sample size is, where parameters such as expected standard deviations or expected differences in values between groups are unknown or very hard to estimate.

  • Cohen's D

    A measure of effect size indicating the amount of different between two groups on a construct of interest in standard deviation units.


Full Text

Required Sample Sizes for Hypothesis Tests

A common problem faced by statisticians is calculating the sample size required to yield a certain power for a test, given a predetermined Type I error rate $\alpha$. As follows, this can be estimated by pre-determined tables for certain values, by Mead's resource equation, or, more generally, by the cumulative distribution function.

By Tables

The table shown in can be used in a two-sample $t$-test to estimate the sample sizes of an experimental group and a control group that are of equal size—that is, the total number of individuals in the trial is twice that of the number given, and the desired significance level is 0.05.

Sample Size Determination

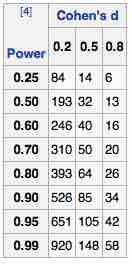
This table can be used in a two-sample $t$-test to estimate the sample sizes of an experimental group and a control group that are of equal size.

The parameters used are:

  • The desired statistical power of the trial, shown in column to the left.
  • Cohen's $D$ (effect size), which is the expected difference between the means of the target values between the experimental group and the control group divided by the expected standard deviation.

Mead's Resource Equation

Mead's resource equation is often used for estimating sample sizes of laboratory animals, as well as in many other laboratory experiments. It may not be as accurate as using other methods in estimating sample size, but gives a hint of what is the appropriate sample size where parameters such as expected standard deviations or expected differences in values between groups are unknown or very hard to estimate.

All the parameters in the equation are in fact the degrees of freedom of the number of their concepts, and hence, their numbers are subtracted by 1 before insertion into the equation. The equation is:

$E=N-B-T$

where:

  • $N$ is the total number of individuals or units in the study (minus 1)
  • $B$ is the blocking component, representing environmental effects allowed for in the design (minus 1)
  • $T$ is the treatment component, corresponding to the number of treatment groups (including control group) being used, or the number of questions being asked (minus 1)
  • $E$ is the degrees of freedom of the error component, and should be somewhere between 10 and 20.

By Cumulative Distribution Function

Let $X_i, i = 1, 2, \dots, n$, be independent observations taken from a normal distribution with unknown mean $\mu$ and known variance $\sigma^2$. Let us consider two hypotheses, a null hypothesis:

$H_0: \mu = 0$

and an alternative hypothesis:

$H_a: \mu = \mu^*$

for some "smallest significant difference" $\mu^* > 0$. This is the smallest value for which we care about observing a difference. Now, if we wish to:

  1. reject $H_0$ with a probability of at least $1-\beta$ when $H_a$ is true (i.e., a power of $1-\beta$), and
  2. reject $H_0$ with probability $\alpha$ when $H_0$ is true,

then we need the following:

If $z_{\alpha}$ is the upper $\alpha$ percentage point of the standard normal distribution, then:

$\displaystyle Pr\left( \frac { \bar { x } >{ z }_{ a }\sigma }{ \sqrt { n } } |{ H }_{ 0 } \ \text{is true} \right) =\alpha$,

and so "reject $H_0$ if our sample average is more than $\frac { { z }_{ a }\sigma }{ \sqrt { n } }$" is a decision rule that satisfies number 2 above. Note that this is a one-tailed test.

[ edit ]
Edit this content
Prev Concept
Comparing Two Population Variances
Hypothesis Tests with the Pearson Correlation
Next Concept
Subjects
  • Accounting
  • Algebra
  • Art History
  • Biology
  • Business
  • Calculus
  • Chemistry
  • Communications
  • Economics
  • Finance
  • Management
  • Marketing
  • Microbiology
  • Physics
  • Physiology
  • Political Science
  • Psychology
  • Sociology
  • Statistics
  • U.S. History
  • World History
  • Writing

Except where noted, content and user contributions on this site are licensed under CC BY-SA 4.0 with attribution required.