A statistical hypothesis test is a method of making decisions using data from a scientific study. In statistics, a result is called statistically significant if it has been predicted as unlikely to have occurred by chance alone, according to a pre-determined threshold probability—the significance level. Statistical hypothesis testing is sometimes called confirmatory data analysis, in contrast to exploratory data analysis, which may not have pre-specified hypotheses. Statistical hypothesis testing is a key technique of frequentist inference.
Statistical hypothesis tests define a procedure that controls (fixes) the probability of incorrectly deciding that a default position (null hypothesis) is incorrect based on how likely it would be for a set of observations to occur if the null hypothesis were true. Note that this probability of making an incorrect decision is not the probability that the null hypothesis is true, nor whether any specific alternative hypothesis is true. This contrasts with other possible techniques of decision theory in which the null and alternative hypothesis are treated on a more equal basis.
The Testing Process
The typical line of reasoning in a hypothesis test is as follows:
- There is an initial research hypothesis of which the truth is unknown.
- The first step is to state the relevant null and alternative hypotheses. This is important as mis-stating the hypotheses will muddy the rest of the process.
- The second step is to consider the statistical assumptions being made about the sample in doing the test—for example, assumptions about the statistical independence or about the form of the distributions of the observations. This is important because invalid assumptions will mean that the results of the test are invalid.
- Decide which test is appropriate, and state the relevant test statistic
$T$ . - Derive the distribution of the test statistic under the null hypothesis from the assumptions.
- Select a significance level (
$\alpha$ ), a probability threshold below which the null hypothesis will be rejected. Common values are 5% and 1%. - The distribution of the test statistic under the null hypothesis partitions the possible values of
$T$ into those for which the null hypothesis is rejected, the so called critical region, and those for which it is not. The probability of the critical region is$\alpha$ . - Compute from the observations the observed value
$t_\text{obs}$ of the test statistic$T$ . - Decide to either reject the null hypothesis in favor of the alternative or not reject it. The decision rule is to reject the null hypothesis
$H_0$ if the observed value$t_\text{obs}$ is in the critical region, and to accept or "fail to reject" the hypothesis otherwise.
An alternative process is commonly used:
7. Compute from the observations the observed value
8. From the statistic calculate a probability of the observation under the null hypothesis (the
9. Reject the null hypothesis in favor of the alternative or not reject it. The decision rule is to reject the null hypothesis if and only if the
The two processes are equivalent. The former process was advantageous in the past when only tables of test statistics at common probability thresholds were available. It allowed a decision to be made without the calculation of a probability. It was adequate for classwork and for operational use, but it was deficient for reporting results. The latter process relied on extensive tables or on computational support not always available. The calculations are now trivially performed with appropriate software.
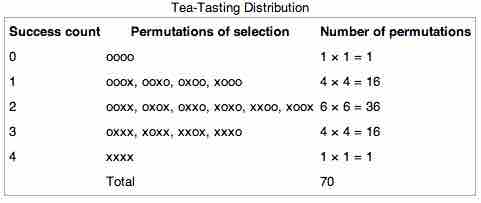
Tea Tasting Distribution
This table shows the distribution of permutations in our tea tasting example.