Statistics
Textbooks
Boundless Statistics
Estimation and Hypothesis Testing
Estimation
Statistics Textbooks Boundless Statistics Estimation and Hypothesis Testing Estimation
Statistics Textbooks Boundless Statistics Estimation and Hypothesis Testing
Statistics Textbooks Boundless Statistics
Statistics Textbooks
Statistics
Concept Version 10
Created by Boundless

Estimation

Estimating population parameters from sample parameters is one of the major applications of inferential statistics.

Learning Objective

  • Describe how to estimate population parameters with consideration of error


Key Points

    • Seldom is the sample statistic exactly equal to the population parameter, so a range of likely values, or an estimate interval, is often given.
    • Error is defined as the difference between the population parameter and the sample statistics.
    • Bias (or systematic error) leads to a sample mean that is either lower or higher than the true mean.
    • Mean-squared error is used to indicate how far, on average, the collection of estimates are from the parameter being estimated.
    • Mean-squared error is used to indicate how far, on average, the collection of estimates are from the parameter being estimated.

Terms

  • interval estimate

    A range of values used to estimate a population parameter.

  • error

    The difference between the population parameter and the calculated sample statistics.

  • point estimate

    a single value estimate for a population parameter


Full Text

One of the major applications of statistics is estimating population parameters from sample statistics. For example, a poll may seek to estimate the proportion of adult residents of a city that support a proposition to build a new sports stadium. Out of a random sample of 200 people, 106 say they support the proposition. Thus in the sample, 0.53 ($\frac{106}{200}$) of the people supported the proposition. This value of 0.53 (or 53%) is called a point estimate of the population proportion. It is called a point estimate because the estimate consists of a single value or point.

It is rare that the actual population parameter would equal the sample statistic. In our example, it is unlikely that, if we polled the entire adult population of the city, exactly 53% of the population would be in favor of the proposition. Instead, we use confidence intervals to provide a range of likely values for the parameter.

For this reason, point estimates are usually supplemented by interval estimates or confidence intervals. Confidence intervals are intervals constructed using a method that contains the population parameter a specified proportion of the time. For example, if the pollster used a method that contains the parameter 95% of the time it is used, he or she would arrive at the following 95% confidence interval: $0.46 < p <0.60$. The pollster would then conclude that somewhere between 46% and 60% of the population supports the proposal. The media usually reports this type of result by saying that 53% favor the proposition with a margin of error of 7%.

Error and Bias

Assume that $\theta $ (the Greek letter "theta") is the value of the population parameter we are interested in. In statistics, we would represent the estimate as $\hat { \theta }$ (read theta-hat). We know that the estimate $\hat { \theta }$ would rarely equal the actual population parameter $\theta $. There is some level of error associated with it. We define this error as $e\left( x \right) =\hat { \theta } \left( x \right) -\theta$.

All measurements have some error associated with them. Random errors occur in all data sets and are sometimes known as non-systematic errors. Random errors can arise from estimation of data values, imprecision of instruments, etc. For example, if you are reading lengths off a ruler, random errors will arise in each measurement as a result of estimating between which two lines the length lies. Bias is sometimes known as systematic error. Bias in a data set occurs when a value is consistently under or overestimated. Bias can also arise from forgetting to take into account a correction factor or from instruments that are not properly calibrated. Bias leads to a sample mean that is either lower or higher than the true mean .

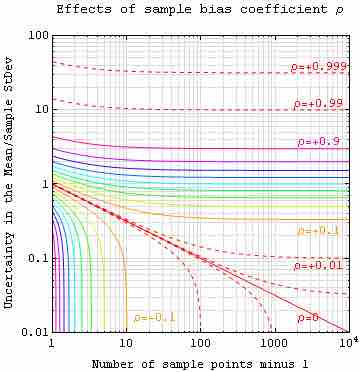
Sample Bias Coefficient

An estimate of expected error in the sample mean of variable $A$, sampled at $N$ locations in a parameter space $x$, can be expressed in terms of sample bias coefficient $\rho$ -- defined as the average auto-correlation coefficient over all sample point pairs. This generalized error in the mean is the square root of the sample variance (treated as a population) times $\frac{1+(N-1)\rho}{(N-1)(1-\rho)}$. The $\rho = 0$ line is the more familiar standard error in the mean for samples that are uncorrelated.

Mean-Squared Error

The mean squared error (MSE) of $\hat { \theta }$ is defined as the expected value of the squared errors. It is used to indicate how far, on average, the collection of estimates are from the single parameter being estimated $\left( \theta \right)$. Suppose the parameter is the bull's-eye of a target, the estimator is the process of shooting arrows at the target, and the individual arrows are estimates (samples). In this case, high MSE means the average distance of the arrows from the bull's-eye is high, and low MSE means the average distance from the bull's-eye is low. The arrows may or may not be clustered. For example, even if all arrows hit the same point, yet grossly miss the target, the MSE is still relatively large. However, if the MSE is relatively low, then the arrows are likely more highly clustered (than highly dispersed).

[ edit ]
Edit this content
Prev Concept
Some Pitfalls: Estimability, Multicollinearity, and Extrapolation
Estimates and Sample Size
Next Concept
Subjects
  • Accounting
  • Algebra
  • Art History
  • Biology
  • Business
  • Calculus
  • Chemistry
  • Communications
  • Economics
  • Finance
  • Management
  • Marketing
  • Microbiology
  • Physics
  • Physiology
  • Political Science
  • Psychology
  • Sociology
  • Statistics
  • U.S. History
  • World History
  • Writing

Except where noted, content and user contributions on this site are licensed under CC BY-SA 4.0 with attribution required.