Statistics
Textbooks
Boundless Statistics
Estimation and Hypothesis Testing
Estimation
Statistics Textbooks Boundless Statistics Estimation and Hypothesis Testing Estimation
Statistics Textbooks Boundless Statistics Estimation and Hypothesis Testing
Statistics Textbooks Boundless Statistics
Statistics Textbooks
Statistics
Concept Version 11
Created by Boundless

Estimates and Sample Size

Here, we present how to calculate the minimum sample size needed to estimate a population mean ($\mu$) and population proportion ($p$).

Learning Objective

  • Calculate sample size required to estimate the population mean


Key Points

    • Before beginning a study, it is important to determine the minimum sample size, taking into consideration the desired level of confidence, the margin of error, and a previously observed sample standard deviation.
    • When $n \geq 30$, the sample standard deviation ($s$) can be used in place of the population standard deviation ($\sigma$).
    • The minimum sample size $n$ needed to estimate the population mean ($\mu$) is calculated using the formula: $n={ \left( \frac { { Z }_{ \frac { \alpha }{ 2 } }\sigma }{ E } \right) }^{ 2 }$.${ \left( \frac { { Z }_{ \frac { \alpha }{ 2 } }\sigma }{ E } \right) }^{ 2 }$. 
    • The minimum sample size $n$ needed to estimate the population proportion ($p$) is calculated using the formula: $n=p'q'\left( \frac { { Z }_{ \frac { \alpha }{ 2 } } }{ E } \right) ^{ 2 }$.

Term

  • margin of error

    An expression of the lack of precision in the results obtained from a sample.


Full Text

Determining Sample Size Required to Estimate the Population Mean ($\mu$)

Before calculating a point estimate and creating a confidence interval, a sample must be taken. Often, the number of data values needed in a sample to obtain a particular level of confidence within a given error needs to be determined before taking the sample. If the sample is too small, the result may not be useful, and if the sample is too big, both time and money are wasted in the sampling. The following text discusses how to determine the minimum sample size needed to make an estimate given the desired confidence level and the observed standard deviation.

First, consider the margin of error, $E$, the greatest possible distance between the point estimate and the value of the parameter it is estimating. To calculate $E$, we need to know the desired confidence level (${ Z }_{ \frac { \alpha }{ 2 } }$) and the population standard deviation, $\sigma$. When $n \geq 30$, the sample standard deviation ($s$) can be used to approximate the population standard deviation $\sigma$.

$\displaystyle E={ Z }_{ \frac { \alpha }{ 2 } }\frac { \sigma }{ \sqrt { n } }$

To change the size of the error ($E$), two variables in the formula could be changed: the level of confidence (${ Z }_{ \frac { \alpha }{ 2 } }$) or the sample size ($n$). The standard deviation ($\sigma$) is a given and cannot change.

As the confidence increases, the margin of error ($E$) increases. To ensure that the margin of error is small, the confidence level would have to decrease. Hence, changing the confidence to lower the error is not a practical solution.

As the sample size ($n$) increases, the margin of error decreases. The question now becomes: how large a sample is needed for a particular error? To determine this, begin by solving the equation for the $E$ in terms of $n$:

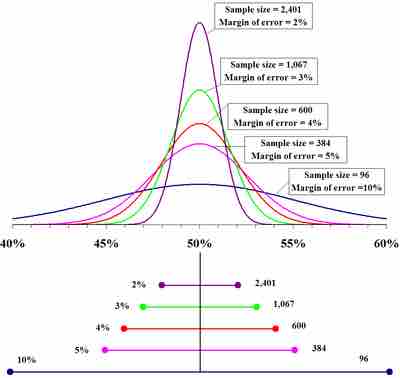
Sample size compared to margin of error

The top portion of this graphic depicts probability densities that show the relative likelihood that the "true" percentage is in a particular area given a reported percentage of 50%. The bottom portion shows the 95% confidence intervals (horizontal line segments), the corresponding margins of error (on the left), and sample sizes (on the right). In other words, for each sample size, one is 95% confident that the "true" percentage is in the region indicated by the corresponding segment. The larger the sample is, the smaller the margin of error is.

$n={ \left( \frac { { Z }_{ \frac { \alpha }{ 2 } }\sigma }{ E } \right) }^{ 2 }$

where ${ Z }_{ \frac { \alpha }{ 2 } }$ is the critical $z$ score based on the desired confidence level, $E$ is the desired margin of error, and $\sigma$ is the population standard deviation.  

Since the population standard deviation is often unknown, the sample standard deviation from a previous sample of size $n\geq 30$ may be used as an approximation to $s$. Now, we can solve for $n$ to see what would be an appropriate sample size to achieve our goals. Note that the value found by using the formula for sample size is generally not a whole number. Since the sample size must be a whole number, always round up to the next larger whole number.

Example

Suppose the scores on a statistics final are normally distributed with a standard deviation of 10 points. Construct a 95% confidence interval with an error of no more than 2 points.

Solution

$Z_{0.025} = 1.645$

$E=2$

$\sigma = 10$

$n={ \left( \frac { 1.645\left( 10 \right) }{ 2 } \right) }^{ 2 }=8.225^2 = 67.75$

So, a sample of size of 68 must be taken to create a 95% confidence interval with an error of no more than 2 points.

Determining Sample Size Required to Estimate Population Proportion ($p$)

The calculations for determining sample size to estimate a proportion ($p$) are similar to those for estimating a mean ($\mu$). In this case, the margin of error, $E$, is found using the formula:

$E={ Z }_{ \frac { \alpha }{ 2 } }\sqrt { \frac { p'q' }{ n } }$

where:

  • $p' = \frac{x}{n}$ is the point estimate for the population proportion
  • $x$ is the number of successes in the sample
  • $n$ is the number in the sample; and
  • $q' = 1-p'$

Then, solving for the minimum sample size $n$ needed to estimate $p$:

$n=p'q'\left( \frac { { Z }_{ \frac { \alpha }{ 2 } } }{ E } \right) ^{ 2 }$

Example

The Mesa College mathematics department has noticed that a number of students place in a non-transfer level course and only need a 6 week refresher rather than an entire semester long course. If it is thought that about 10% of the students fall in this category, how many must the department survey if they wish to be 95% certain that the true population proportion is within $\pm 5\%$?

Solution

$Z=1.96 \\ E=0.05 \\ p' = 0.1 \\ q' = 0.9 \\ n=\left( 0.1 \right) \left( 0.9 \right) \left( \frac { 1.96 }{ 0.05 } \right) ^{ 2 }\approx 138.3$

So, a sample of size of 139 must be taken to create a 95% confidence interval with an error of $\pm 5\%$.

[ edit ]
Edit this content
Prev Concept
Estimation
Estimating the Target Parameter: Point Estimation
Next Concept
Subjects
  • Accounting
  • Algebra
  • Art History
  • Biology
  • Business
  • Calculus
  • Chemistry
  • Communications
  • Economics
  • Finance
  • Management
  • Marketing
  • Microbiology
  • Physics
  • Physiology
  • Political Science
  • Psychology
  • Sociology
  • Statistics
  • U.S. History
  • World History
  • Writing

Except where noted, content and user contributions on this site are licensed under CC BY-SA 4.0 with attribution required.