Statistics
Textbooks
Boundless Statistics
Estimation and Hypothesis Testing
Estimation
Statistics Textbooks Boundless Statistics Estimation and Hypothesis Testing Estimation
Statistics Textbooks Boundless Statistics Estimation and Hypothesis Testing
Statistics Textbooks Boundless Statistics
Statistics Textbooks
Statistics
Concept Version 8
Created by Boundless

Estimating a Population Proportion

In order to estimate a population proportion of some attribute, it is helpful to rely on the proportions observed within a sample of the population.

Learning Objective

  • Derive the population proportion using confidence intervals


Key Points

    • If you want to rely on a sample, it is important that the sample be random (i.e., done in such as way that each member of the underlying population had an equal chance of being selected for the sample).
    • As the size of a random sample increases, there is greater "confidence" that the observed sample proportion will be "close" to the actual population proportion.
    • For general estimates of a population proportion, we use the formula: $\sqrt{\frac{\hat{p}(1-\hat{p})}{n}}$.
    • To estimate a population proportion to be within a specific confidence interval, we use the formula: $\hat{p}\pm z^{*}\sqrt{\frac{\hat{p}(1-\hat{p})}{n}}$.

Terms

  • standard error

    A measure of how spread out data values are around the mean, defined as the square root of the variance.

  • confidence interval

    A type of interval estimate of a population parameter used to indicate the reliability of an estimate.


Full Text

Facts About Population Proportions

You do not need to be a math major or a professional statistician to have an intuitive appreciation of the following:

  • In order to estimate the proportions of some attribute within a population, it would be helpful if you could rely on the proportions observed within a sample of the population.
  • If you want to rely on a sample, it is important that the sample be random. This means that the sampling was done in such a way that each member of the underlying population had an equal chance of being selected for the sample.
  • The size of the sample is important. As the size of a random sample increases, there is greater "confidence" that the observed sample proportion will be "close" to the actual population proportion. If you were to toss a fair coin ten times, it would not be that surprising to get only 3 or fewer heads (a sample proportion of 30% or less). But if there were 1,000 tosses, most people would agree – based on intuition and general experience – that it would be very unlikely to get only 300 or fewer heads. In other words, with the larger sample size, it is generally apparent that the sample proportion will be closer to the actual "population" proportion of 50%.
  • While the sample proportion might be the best estimate of the total population proportion, you would not be very confident that this is exactly the population proportion.

Finding the Population Proportion Using Confidence Intervals

Let's look at the following example. Assume a political pollster samples 400 voters and finds 208 for Candidate $A$ and 192 for Candidate $B$. This leads to an estimate of 52% as $A$'s support in the population. However, it is unlikely that $A$'s support actual will be exactly 52%. We will call 0.52 $\hat{p}$ (pronounced "p-hat"). The population proportion, $p$, is estimated using the sample proportion $\hat{p}$. However, the estimate is usually off by what is called the standard error (SE). The SE can be calculated by:

 $\displaystyle \sqrt{\frac{\hat{p}(1-\hat{p})}{n}}$

where $n$ is the sample size. So, in this case, the SE is approximately equal to 0.02498. Therefore, a good population proportion for this example would be $0.52 \pm 0.2498$.

Often, statisticians like to use specific confidence intervals for $p$. This is computed slightly differently, using the formula:

$\displaystyle \hat{p}\pm z^{*}\sqrt{\frac{\hat{p}(1-\hat{p})}{n}}$ 

where $z^*$ is the upper critical value of the standard normal distribution. In the above example, if we wished to calculate $p$ with a confidence of 95%, we would use a $Z$-value of 1.960 (found using a critical value table), and we would find $p$ to be estimated as $0.52\pm0.04896$. So, we could say with 95% confidence that between 47.104% and 56.896% of the people will vote for candidate $A$.

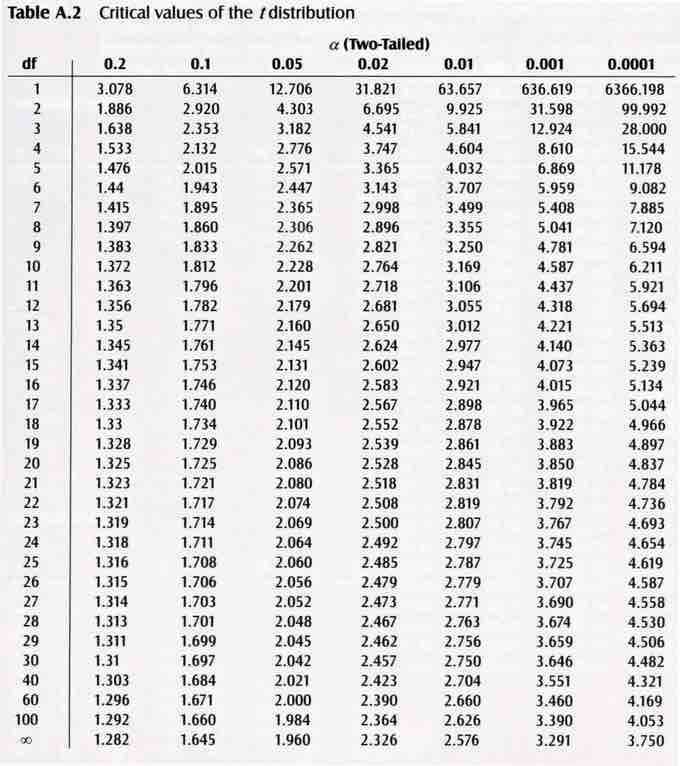
Critical Value Table

$t$-table used for finding $z^*$ for a certain level of confidence.

A simple guideline – If you use a confidence level of $X\%$, you should expect $(100-X)\%$ of your conclusions to be incorrect. So, if you use a confidence level of 95%, you should expect 5% of your conclusions to be incorrect.

[ edit ]
Edit this content
Prev Concept
Estimating the Target Parameter: Interval Estimation
Statistical Power
Next Concept
Subjects
  • Accounting
  • Algebra
  • Art History
  • Biology
  • Business
  • Calculus
  • Chemistry
  • Communications
  • Economics
  • Finance
  • Management
  • Marketing
  • Microbiology
  • Physics
  • Physiology
  • Political Science
  • Psychology
  • Sociology
  • Statistics
  • U.S. History
  • World History
  • Writing

Except where noted, content and user contributions on this site are licensed under CC BY-SA 4.0 with attribution required.