Measures of relative standing, in the statistical sense, can be defined as measures that can be used to compare values from different data sets, or to compare values within the same data set.
Quartiles and Percentiles
The common measures of relative standing or location are quartiles and percentiles. A percentile is a measure used in statistics indicating the value below which a given percentage of observations in a group of observations fall. For example, the 20th percentile is the value (or score) below which 20 percent of the observations may be found. The term percentile and the related term, percentile rank, are often used in the reporting of scores from norm-referenced tests. For example, if a score is in the 86th percentile, it is higher than 86% of the other scores. The 25th percentile is also known as the first quartile (Q1), the 50th percentile as the median or second quartile (Q2), and the 75th percentile as the third quartile (Q3).
To calculate quartiles and percentiles, the data must be ordered from smallest to largest. Recall that quartiles divide ordered data into quarters. Percentiles divide ordered data into hundredths. To score in the 90th percentile of an exam does not mean, necessarily, that you received 90% on a test. It means that 90% of test scores are the same or less than your score and 10% of the test scores are the same or greater than your test score.
Percentiles are useful for comparing values. For this reason, universities and colleges use percentiles extensively. Percentiles are mostly used with very large populations. Therefore, if you were to say that 90% of the test scores are less (and not the same or less) than your score, it would be acceptable because removing one particular data value is not significant.
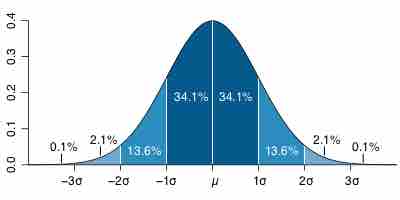
For very large populations following a normal distribution, percentiles may often be represented by reference to a normal curve plot. The normal distribution is plotted along an axis scaled to standard deviations, or sigma units. Percentiles represent the area under the normal curve, increasing from left to right. Each standard deviation represents a fixed percentile. Thus, rounding to two decimal places,
Percentile Diagram
Representation of the 68–95–99.7 rule. The dark blue zone represents observations within one standard deviation (
Note that in theory the 0th percentile falls at negative infinity and the 100th percentile at positive infinity; although, in many practical applications, such as test results, natural lower and/or upper limits are enforced.
Interpreting Percentiles, Quartiles, and Median
A percentile indicates the relative standing of a data value when data are sorted into numerical order, from smallest to largest.
A percentile may or may not correspond to a value judgment about whether it is "good" or "bad". The interpretation of whether a certain percentile is good or bad depends on the context of the situation to which the data applies. In some situations, a low percentile would be considered "good'; in other contexts a high percentile might be considered "good". In many situations, there is no value judgment that applies.
Understanding how to properly interpret percentiles is important not only when describing data, but is also important when calculating probabilities.
Guideline:
When writing the interpretation of a percentile in the context of the given data, the sentence should contain the following information:
- information about the context of the situation being considered,
- the data value (value of the variable) that represents the percentile,
- the percent of individuals or items with data values below the percentile.
- Additionally, you may also choose to state the percent of individuals or items with data values above the percentile.