Statistics
Textbooks
Boundless Statistics
Describing, Exploring, and Comparing Data
Measures of Relative Standing
Statistics Textbooks Boundless Statistics Describing, Exploring, and Comparing Data Measures of Relative Standing
Statistics Textbooks Boundless Statistics Describing, Exploring, and Comparing Data
Statistics Textbooks Boundless Statistics
Statistics Textbooks
Statistics
Concept Version 5
Created by Boundless

Measures of Relative Standing

Percentile Diagram

Percentile Diagram

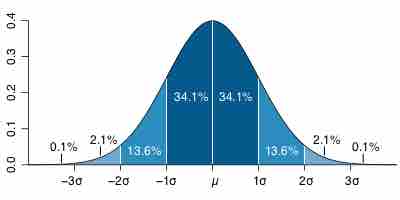
Representation of the 68–95–99.7 rule. The dark blue zone represents observations within one standard deviation ($\sigma$) to either side of the mean ($\mu$), which accounts for about 68.2% of the population. Two standard deviations from the mean (dark and medium blue) account for about 95.4%, and three standard deviations (dark, medium, and light blue) for about 99.7%.

Source

    Boundless vets and curates high-quality, openly licensed content from around the Internet. This particular resource used the following sources:

    "Standard deviation diagram."
    http://en.wikipedia.org/wiki/File:Standard_deviation_diagram.svg Wikipedia CC BY.

Related Terms

  • percentile
  • quartile
  • Subjects
    • Accounting
    • Algebra
    • Art History
    • Biology
    • Business
    • Calculus
    • Chemistry
    • Communications
    • Economics
    • Finance
    • Management
    • Marketing
    • Microbiology
    • Physics
    • Physiology
    • Political Science
    • Psychology
    • Sociology
    • Statistics
    • U.S. History
    • World History
    • Writing

    Except where noted, content and user contributions on this site are licensed under CC BY-SA 4.0 with attribution required.