Statistics
Textbooks
Boundless Statistics
Describing, Exploring, and Comparing Data
Measures of Relative Standing
Statistics Textbooks Boundless Statistics Describing, Exploring, and Comparing Data Measures of Relative Standing
Statistics Textbooks Boundless Statistics Describing, Exploring, and Comparing Data
Statistics Textbooks Boundless Statistics
Statistics Textbooks
Statistics
Concept Version 6
Created by Boundless

Median

The median is the middle value in distribution when the values are arranged in ascending or descending order.

Learning Objective

  • Identify the median in a data set and distinguish it's properties from other measures of central tendency.


Key Points

    • The median divides the distribution in half (there are 50% of observations on either side of the median value). In a distribution with an odd number of observations, the median value is the middle value.
    • When the distribution has an even number of observations, the median value is the mean of the two middle values.
    • The median is less affected by outliers and skewed data than the mean, and is usually the preferred measure of central tendency when the distribution is not symmetrical.
    • he median cannot be identified for categorical nominal data, as it cannot be logically ordered.

Terms

  • outlier

    a value in a statistical sample which does not fit a pattern that describes most other data points; specifically, a value that lies 1.5 IQR beyond the upper or lower quartile

  • median

    the numerical value separating the higher half of a data sample, a population, or a probability distribution, from the lower half


Full Text

A measure of central tendency (also referred to as measures of center or central location) is a summary measure that attempts to describe a whole set of data with a single value that represents the middle or center of its distribution. There are three main measures of central tendency: the mode, the median and the mean . Each of these measures describes a different indication of the typical or central value in the distribution.

Central tendency

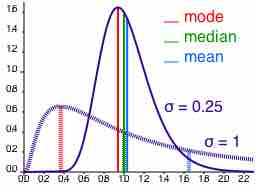
Comparison of mean, median and mode of two log-normal distributions with different skewness.

The median is the middle value in distribution when the values are arranged in ascending or descending order. The median divides the distribution in half (there are 50% of observations on either side of the median value). In a distribution with an odd number of observations, the median value is the middle value.

Looking at the retirement age distribution (which has 11 observations), the median is the middle value, which is 57 years:

54, 54, 54, 55, 56, 57, 57, 58, 58, 60, 60

When the distribution has an even number of observations, the median value is the mean of the two middle values. In the following distribution, the two middle values are 56 and 57, therefore the median equals 56.5 years:

52, 54, 54, 54, 55, 56, 57, 57, 58, 58, 60, 60

The median is less affected by outliers and skewed data than the mean, and is usually the preferred measure of central tendency when the distribution is not symmetrical. The median cannot be identified for categorical nominal data, as it cannot be logically ordered.

[ edit ]
Edit this content
Prev Concept
Measures of Relative Standing
Mode
Next Concept
Subjects
  • Accounting
  • Algebra
  • Art History
  • Biology
  • Business
  • Calculus
  • Chemistry
  • Communications
  • Economics
  • Finance
  • Management
  • Marketing
  • Microbiology
  • Physics
  • Physiology
  • Political Science
  • Psychology
  • Sociology
  • Statistics
  • U.S. History
  • World History
  • Writing

Except where noted, content and user contributions on this site are licensed under CC BY-SA 4.0 with attribution required.