Statistics
Textbooks
Boundless Statistics
Describing, Exploring, and Comparing Data
Further Considerations for Data
Statistics Textbooks Boundless Statistics Describing, Exploring, and Comparing Data Further Considerations for Data
Statistics Textbooks Boundless Statistics Describing, Exploring, and Comparing Data
Statistics Textbooks Boundless Statistics
Statistics Textbooks
Statistics
Concept Version 7
Created by Boundless

The Sample Average

The sample average/mean can be calculated taking the sum of every piece of data and dividing that sum by the total number of data points.

Learning Objective

  • Distinguish the sample mean from the population mean.


Key Points

    • The sample mean makes a good estimator of the population mean, as its expected value is equal to the population mean. The law of large numbers dictates that the larger the size of the sample, the more likely it is that the sample mean will be close to the population mean.
    • The sample mean of a population is a random variable, not a constant, and consequently it will have its own distribution.
    • The mean is the arithmetic average of a set of values, or distribution; however, for skewed distributions, the mean is not necessarily the same as the middle value (median), or the most likely (mode).

Terms

  • random variable

    a quantity whose value is random and to which a probability distribution is assigned, such as the possible outcome of a roll of a die

  • finite

    limited, constrained by bounds, having an end


Full Text

Sample Average vs. Population Average

The sample average (also called the sample mean) is often referred to as the arithmetic mean of a sample, or simply, $\bar{x}$ (pronounced "x bar"). The mean of a population is denoted $\mu$, known as the population mean. The sample mean makes a good estimator of the population mean, as its expected value is equal to the population mean. The sample mean of a population is a random variable, not a constant, and consequently it will have its own distribution. For a random sample of $n$ observations from a normally distributed population, the sample mean distribution is:

$\displaystyle \bar{x}\sim N\left \{ \mu ,\frac{\sigma ^2}{n}\right \}$

For a finite population, the population mean of a property is equal to the arithmetic mean of the given property while considering every member of the population. For example, the population mean height is equal to the sum of the heights of every individual divided by the total number of individuals.The sample mean may differ from the population mean, especially for small samples. The law of large numbers dictates that the larger the size of the sample, the more likely it is that the sample mean will be close to the population mean.

Calculation of the Sample Mean

The arithmetic mean is the "standard" average, often simply called the "mean". It can be calculated taking the sum of every piece of data and dividing that sum by the total number of data points:

$\displaystyle \bar{x}= \frac{1}{n}\cdot \sum_{i=1}^{n}x_{i}$

For example, the arithmetic mean of five values: 4, 36, 45, 50, 75 is:

$\displaystyle \frac{4+36+45+50+75}{5}=\frac{210}{5}= 42$

The mean may often be confused with the median, mode or range. The mean is the arithmetic average of a set of values, or distribution; however, for skewed distributions, the mean is not necessarily the same as the middle value (median), or the most likely (mode). For example, mean income is skewed upwards by a small number of people with very large incomes, so that the majority have an income lower than the mean. By contrast, the median income is the level at which half the population is below and half is above. The mode income is the most likely income, and favors the larger number of people with lower incomes. The median or mode are often more intuitive measures of such data .

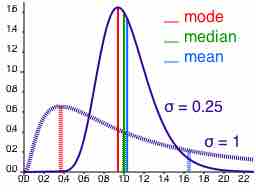
Measures of Central Tendency

This graph shows where the mean, median, and mode fall in two different distributions (one is slightly skewed left and one is highly skewed right).

[ edit ]
Edit this content
Prev Concept
Making a Box Model
Which Standard Deviation (SE)?
Next Concept
Subjects
  • Accounting
  • Algebra
  • Art History
  • Biology
  • Business
  • Calculus
  • Chemistry
  • Communications
  • Economics
  • Finance
  • Management
  • Marketing
  • Microbiology
  • Physics
  • Physiology
  • Political Science
  • Psychology
  • Sociology
  • Statistics
  • U.S. History
  • World History
  • Writing

Except where noted, content and user contributions on this site are licensed under CC BY-SA 4.0 with attribution required.