A single statistic tells only part of a dataset's story. The mean is one perspective; the median yet another. When we explore relationships between multiple variables, even more statistics arise, such as the coefficient estimates in a regression model or the Cochran-Maentel-Haenszel test statistic in partial contingency tables. A multitude of statistics are available to summarize and test data.
Our ultimate goal in statistics is not to summarize the data, it is to fully understand their complex relationships. A well designed statistical graphic helps us explore, and perhaps understand, these relationships. A box plot (also called a box and whisker diagram) is a simple visual representation of key features of a univariate sample.
The box lies on a vertical axis in the range of the sample. Typically, a top to the box is placed at the first quartile, the bottom at the third quartile. The width of the box is arbitrary, as there is no x-axis. In between the top and bottom of the box is some representation of central tendency. A common version is to place a horizontal line at the median, dividing the box into two. Additionally, a star or asterisk is placed at the mean value, centered in the box in the horizontal direction.
Another common extension of the box model is the 'box-and-whisker' plot , which adds vertical lines extending from the top and bottom of the plot to, for example, the maximum and minimum values. Alternatively, the whiskers could extend to the 2.5 and 97.5 percentiles. Finally, it is common in the box-and-whisker plot to show outliers (however defined) with asterisks at the individual values beyond the ends of the whiskers.
Box-and-Whisker Plot
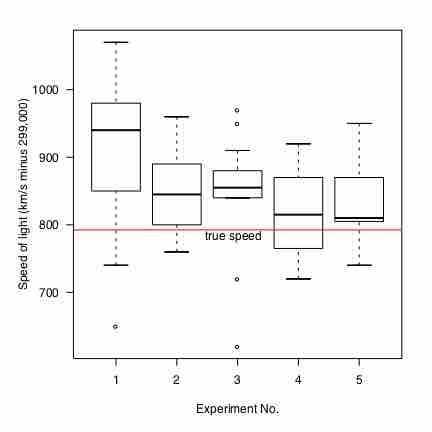
Box plot of data from the Michelson-Morley Experiment, which attempted to detect the relative motion of matter through the stationary luminiferous aether.

Box Plot
Box plot of data from the Michelson-Morley Experiment.