Statistics
Textbooks
Boundless Statistics
Continuous Random Variables
Statistics Textbooks Boundless Statistics Continuous Random Variables
Statistics Textbooks Boundless Statistics
Statistics Textbooks
Statistics

Section 1

The Normal Curve

Book Version 1
By Boundless
Boundless Statistics
Statistics
by Boundless
View the full table of contents
7 concepts
Thumbnail
Continuous Probability Distributions

A continuous probability distribution is a representation of a variable that can take a continuous range of values.

Thumbnail
The Uniform Distribution

The continuous uniform distribution is a family of symmetric probability distributions in which all intervals of the same length are equally probable.

The Exponential Distribution

The exponential distribution is a family of continuous probability distributions that describe the time between events in a Poisson process.

The Normal Distribution

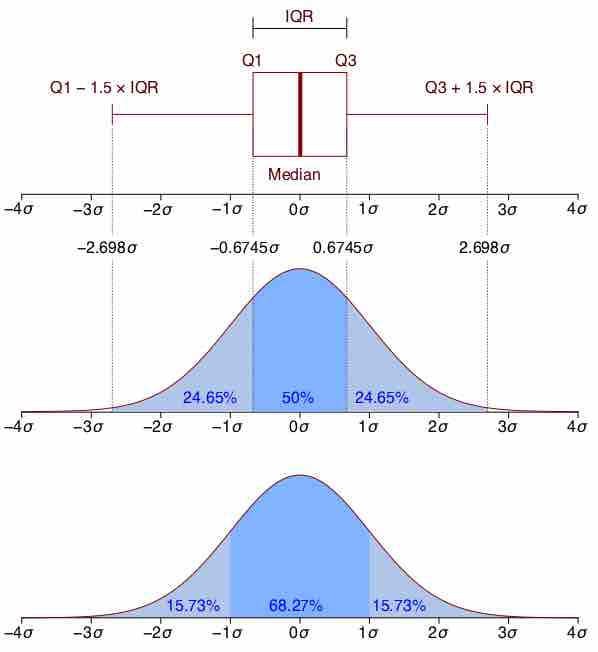
The normal distribution is symmetric with scores more concentrated in the middle than in the tails.
Thumbnail
Graphing the Normal Distribution

The graph of a normal distribution is a bell curve.
Thumbnail
The Standard Normal Curve

The standard normal distribution is a normal distribution with a mean of 0 and a standard deviation of 1.
Thumbnail
Finding the Area Under the Normal Curve

To calculate the probability that a variable is within a range in the normal distribution, we have to find the area under the normal curve.

Subjects
  • Accounting
  • Algebra
  • Art History
  • Biology
  • Business
  • Calculus
  • Chemistry
  • Communications
  • Economics
  • Finance
  • Management
  • Marketing
  • Microbiology
  • Physics
  • Physiology
  • Political Science
  • Psychology
  • Sociology
  • Statistics
  • U.S. History
  • World History
  • Writing

Except where noted, content and user contributions on this site are licensed under CC BY-SA 4.0 with attribution required.