What is a Probability Histogram?
It is often useful to display the data collected in an experiment in the form of a histogram. Having a graphical representation is helpful because it allows the researcher to visualize what shape the distribution takes.
Probability histograms are similar to relative frequency histograms in that the Y-axis is labeled with probabilities, but there are some differences to be noted. In a probability histogram, the height of each bar shows the true probability of each outcome if there were to be a very large number of trials (not the actual relative frequencies determined by actually conducting an experiment). Because the heights are all probabilities, they must add up to one. Think of these probability histograms as idealized pictures of the results of an experiment. Simply looking at probability histograms makes it easy to see what kind of distribution the data follow .
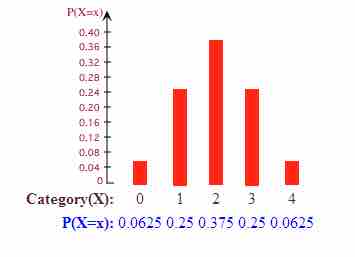
Probability Histogram
This probability histogram shows the probabilities that 0, 1, 2, 3, or 4 heads will show up on four tosses of a fair coin.
How Can We Tell If the Data is Approximately Normal?
The above example of a probability histogram is an example of one that is normal. How can we tell? The most obvious way is to look at the histogram itself. If the graph is approximately bell-shaped and symmetric about the mean, you can usually assume normality.
There is another method, however, than can help: a normal probability plot. A normal probability plot is a graphical technique for normality testing--assessing whether or not a data set is approximately normally distributed. The data are plotted against a theoretical normal distribution in such a way that the points form an approximate straight line . Departures from this straight line indicate departures from normality. It is important to remember not to overreact to minor wiggles in the plot. These plots are not often produced by hand, but rather by technological tools such as a graphing calculator.

Normal Probability Plot
The data points do not deviate far from the straight line, so we can assume the distribution is approximately normal.
Approximately Normal Distributions in Real Life
We study the normal distribution extensively because many things in real life closely approximate the normal distribution, including:
- The heights of people
- The sizes of things produced by machines
- Errors in measurements
- Blood pressure
- Scores on a standardized test