Statistics
Textbooks
Boundless Statistics
Continuous Random Variables
Statistics Textbooks Boundless Statistics Continuous Random Variables
Statistics Textbooks Boundless Statistics
Statistics Textbooks
Statistics

Section 5

Normal Approximation for Probability Histograms

Book Version 1
By Boundless
Boundless Statistics
Statistics
by Boundless
View the full table of contents
3 concepts
Probability Histograms

A probability histogram is a graph that shows the probability of each outcome on the yyy-axis.

Thumbnail
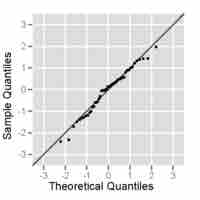
Probability Histograms and the Normal Curve

Many different types of distributions can be approximated by the normal curve.

Thumbnail
Conclusion

Many distributions in real life can be approximated using normal distribution.

Subjects
  • Accounting
  • Algebra
  • Art History
  • Biology
  • Business
  • Calculus
  • Chemistry
  • Communications
  • Economics
  • Finance
  • Management
  • Marketing
  • Microbiology
  • Physics
  • Physiology
  • Political Science
  • Psychology
  • Sociology
  • Statistics
  • U.S. History
  • World History
  • Writing

Except where noted, content and user contributions on this site are licensed under CC BY-SA 4.0 with attribution required.