Managers can use many different quantitative and analytic tools to better understand workflow processes, financial management, and employee efficiency. These tools, such as decision tress, simulation, trend charts, benchmarking, and financial projections, help managers improve their decision-making abilities, determine how the business is performing relative to competitors, and discover opportunities for improvement. Using these tools to create quantitative and measurable metrics helps an organization see exactly where it is performing well and where it is performing poorly.
Types of Quantitative Tools
Decision Tree
A decision tree is a branching graph or model of decisions and their possible consequences, including chance event outcomes, resource costs, and utility. Decision trees are commonly used in operations research (specifically in decision analysis) to help identify a strategy most likely to reach a specified goal. They can also be used to map out a thought process or the possible consequences of a decision. A manager may use this tool when deciding between different projects or investments.
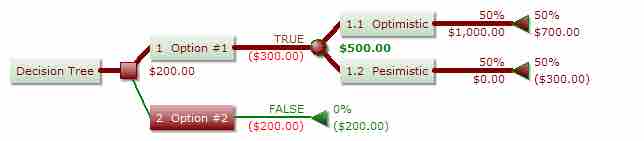
Decision tree
Decision trees are used to determine the consequences and potential outcomes of an investment or a project. This decision tree shows the money lost or gained at each step along multiple potential paths of action. The path that results in the highest financial gain by the end is generally the one that should be chosen.
Simulation
Simulation is the imitation of a real-world process or system over time. The act of simulating something first requires that a model be developed; this model represents the key characteristics or behaviors of the selected physical or abstract system or process. A simulation could be used to study investment decisions by actively playing out what may happen in certain situations.
Trend Chart
Trend charts are often used to display data over time to explore any potential trends (either positive or negative) that require additional attention by management. Many metrics are analyzed using trend charts, including employee productivity, financial metrics, operational efficiency, and comparisons between competitors. Trends are only ever in the past, however, and utilizing confidence intervals when projected with trends is critical to their effectiveness.
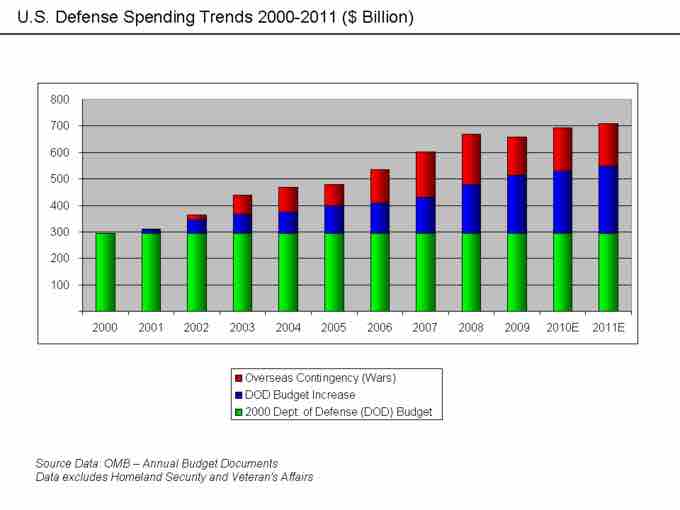
Trend chart
A trend chart shows changes in spending, prices, efficiency, or any other metric that management is interested in analyzing over time. This chart of U.S. defense spending from 2000–2011 shows that overall spending increased from $300 billion to $700 billion due to increases in both the Department of Defense (DOD) budget and overseas (war-related) spending.
Benchmarking
Benchmarking allows a manager to see how different aspects of a business (usually quality, time, and cost) are performing compared to national, regional, and industry standards. It also allows a manager to explore how the company is performing compared to competitors. In the process of benchmarking, management identifies the best firms in the industry, or in another industry where similar processes exist, and compares the results and processes of the target firms to management's own results and processes. In this way, management learns how well the targets perform and, more importantly, the business processes that explain why these firms are successful.
Financial Projections
Managers can also use financial analysis as a management tool. When investing in a project or an acquisition of any kind, a manager will always want to know how quickly the investment will bring in a profit. For example, when a company invests in a new building, management will calculate how long it will take for the building to generate enough income to cover the upfront cost of the building and therefore start bringing in profits. This calculation is sometimes called a payback period. Payback period intuitively measures how long something takes to pay for itself. All else being equal, shorter payback periods are preferable to longer payback periods. This is often referred to as an NPV, or a net present value, where the company calculates the future value of the project in today's dollars. It is critical to remember that a dollar today and a dollar tomorrow have a different value.