In Business Economics, specifically cost accounting, the break-even point (BEP) is the point at which cost (or expenses) and revenue are equal—there is no net loss or gain, i.e., one can "break even. " No profit is achieved nor loss incurred, although opportunity costs are reconciled, and capital receives the risk-adjusted, expected return. Shown graphically, it is seen at the point where the total revenue and total cost curves meet. In the linear model, the break-even point is equal to the fixed costs divided by the contribution margin per unit .
Break-Even Analysis
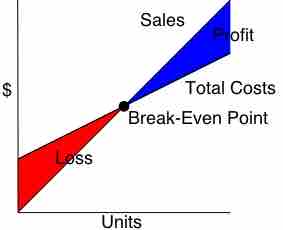
This graphs depicts an example of a break-even point based on sales and total costs.
Example: Suppose that if a business sells fewer than 200 tables each month it will incur a loss, and if it sells more it will turn a profit. Given this scenario, the company's business managers will need to compile information to determine if they can reasonably manufacture and sell 200 tables per month.
If they think they cannot sell that many, to ensure continued viability they might:
- Try reducing their fixed costs (e.g., by renegotiating rent, or by better controlling utility telephone bills or other costs)
- Try reducing their variable costs (the price paid for the tables by finding a new supplier)
- Consider increasing the selling price of their tables
Any of these would reduce the break-even point, meaning the business would not need to sell so many tables to ensure it could pay its fixed costs.
By inserting different prices into the formula, you will obtain a number of break-even points, one for each possible price point. If in the above example the firm changes the selling price for its product, say from $2 to $2.30, then it would have to sell only 589 units (1000/(2.3 - 0.6) = 589) to break even rather than 715.
Graphing these results can make them more clear. To do this, draw the total cost curve (TC in the diagram), showing total cost associated with each possible level of output; the fixed cost curve (FC), showing costs that do not vary with output level; and finally, the various total revenue lines (R1, R2, and R3), showing the total amount of revenue received at each output level given the chosen price point.
The break-even point is one of the simplest yet least used analytical tools in management. It helps provide a dynamic view of the relationships between sales, costs and profits. For an even clearer understanding, break-even sales can be expressed as a percentage of actual sales. By linking the percent to a point (during the week or month) that the percent of sales might occur, managers can glean when they might expect to break even.